


Bubble Trouble: The Financial Soap Opera of McBride Detergents
Your guide to Surfactants, Fatty Alcohols, Palm Oil and More

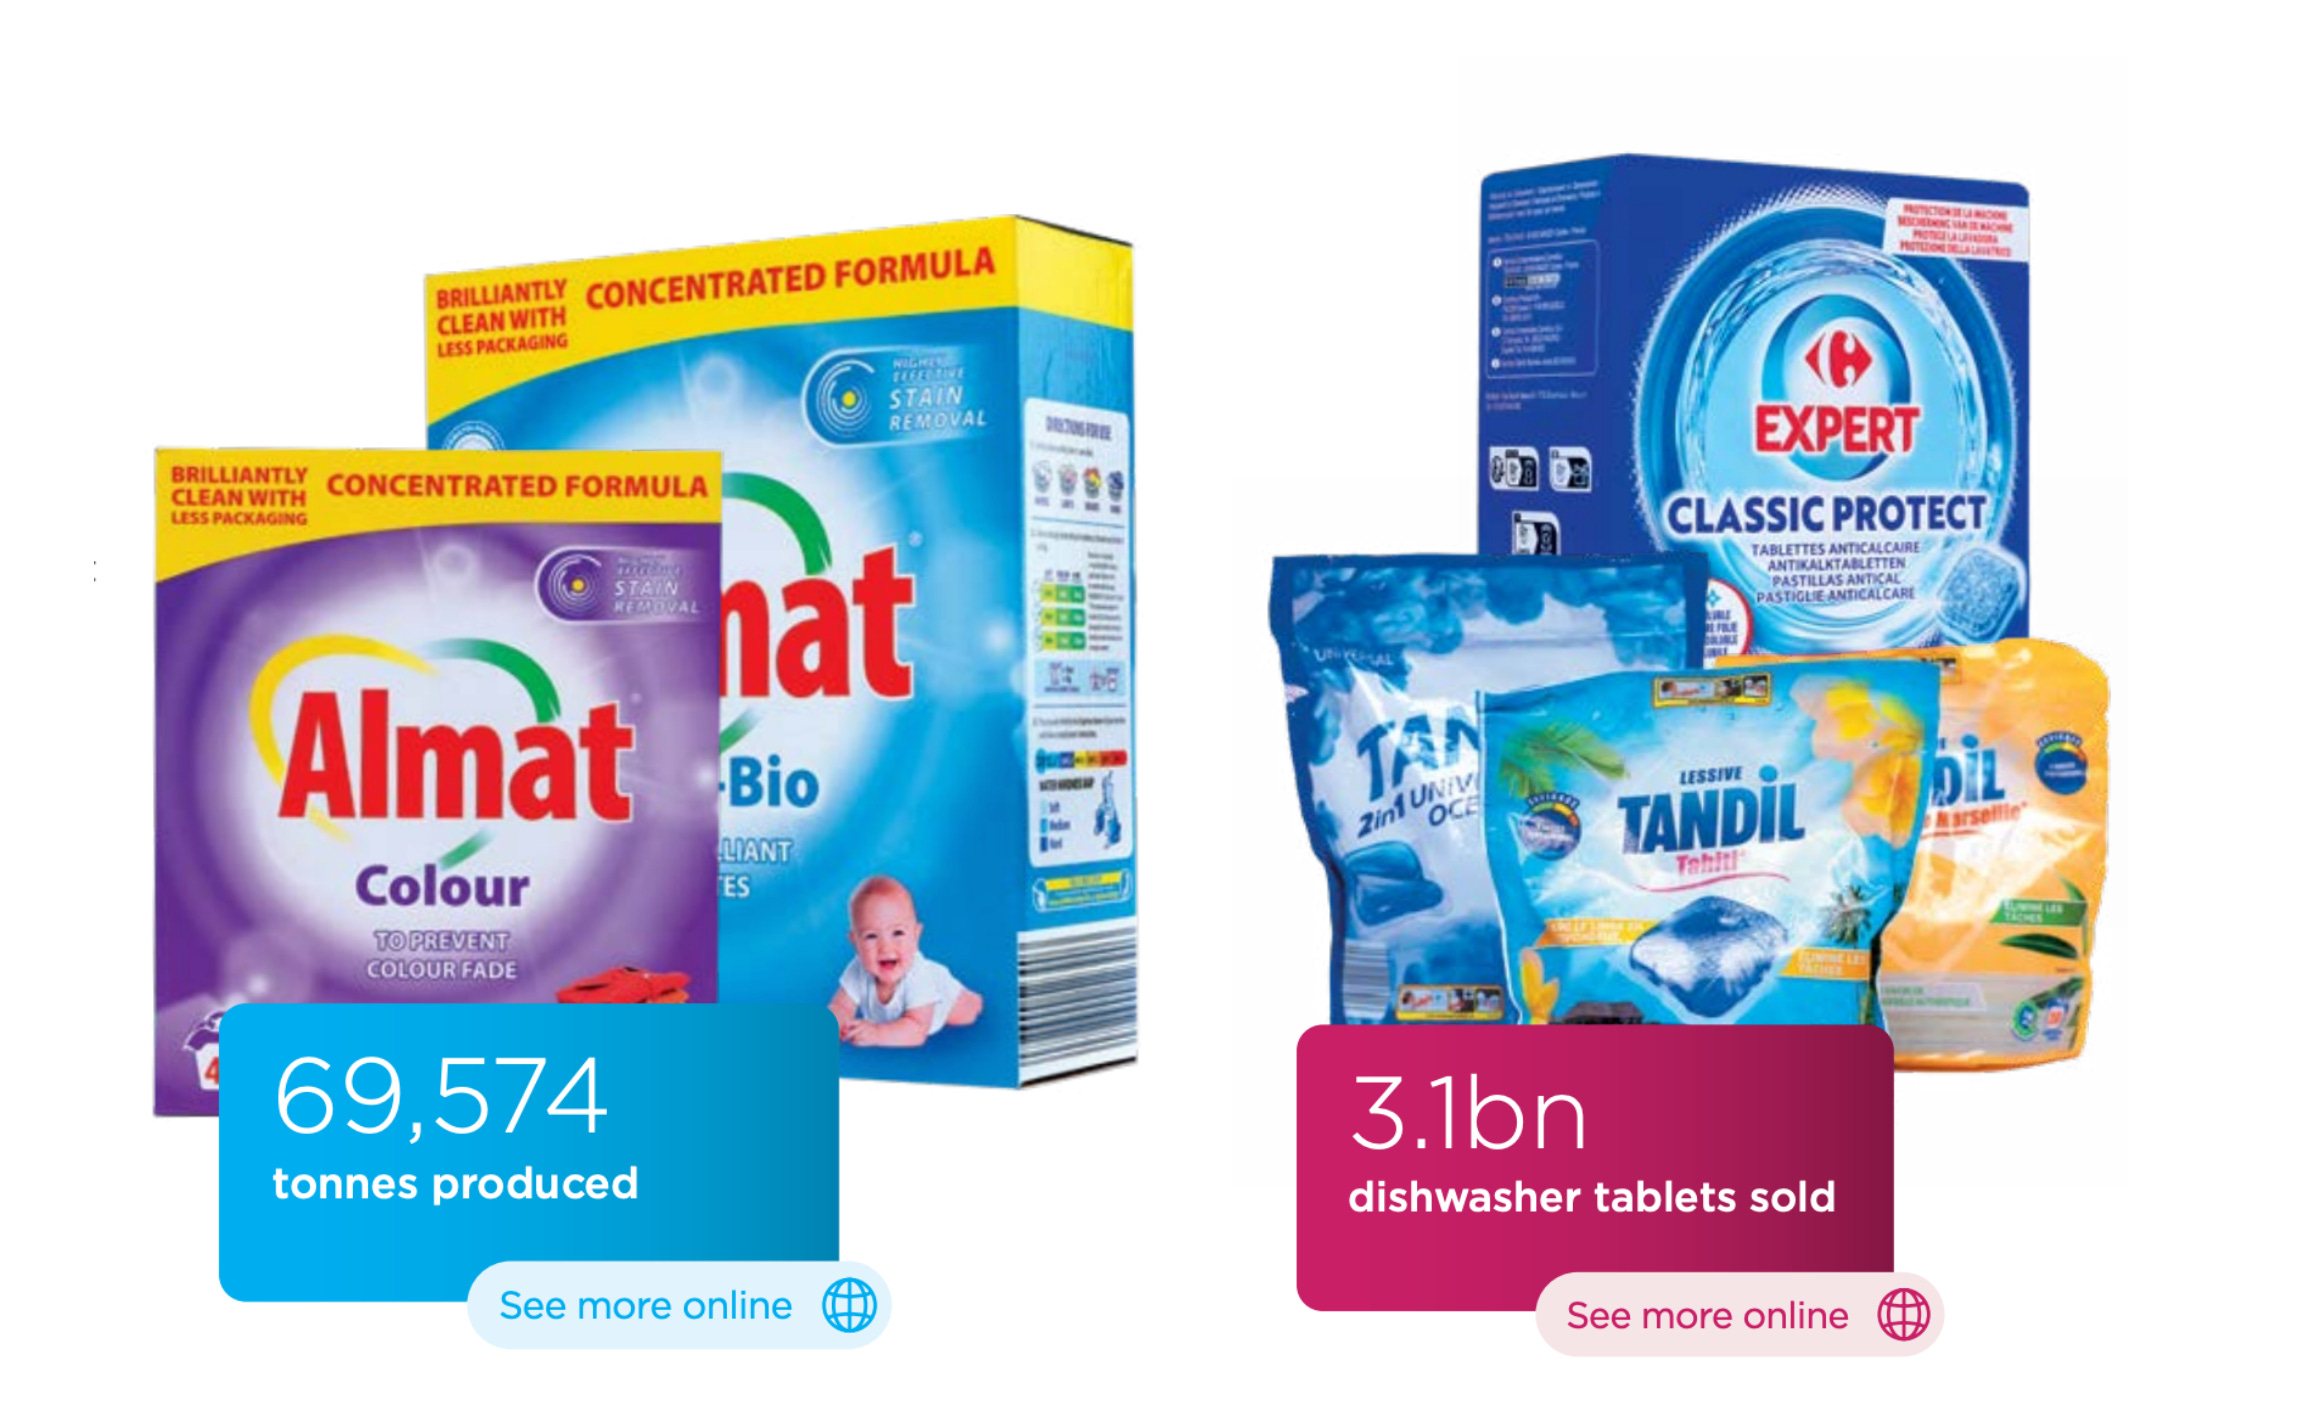
McBride is Europe's leading private label manufacturer of laundry detergents. It has a dominant market share in most of its product categories and sells to all top retailers. For example, it manufactures Sainsbury’s and Tescos own brand of dishwashing Liquids.
During the pandemic, the business faced a “tsunami” of input cost inflation, which it was unable to pass on to customers — resulting in losses. Since then, management has been focused on turning the business around, culminating in record profits in FY24. Currently, the stock trades at an attractive EV/EBIT multiple of less than 5. Crucially, reducing debt could further lower this multiple and unlock a potential catalyst in the form of dividends.
This turnaround story has garnered attention in the past, with Alluvial Capital making the stock their second-largest position. However, since August, the stock price has lagged. The most recent trading update cited “volatile commodity prices” but also confirmed that performance remains “in line” with market expectations. This mixed messaging has compounded investor scepticism.
In this write-up, the primary focus will be on analysing the chemical composition, supply chains, and feedstock prices behind McBride’s products to better understand cost inflation and impacts on operating margin. As a bonus, I will also provide an idea for hedging some of the commodity inflation.
This deep dive will also serve as an introductory guide to the surfactants chemical industry, helping investors better understand companies such as BASF, Henkel, Stepan, Procter & Gamble, and Evonik.
Valuation Snapshot:
EV: £310
MC: £180
Net Debt: £130
EBIT: £64.3
EV/EBIT: 4.8x
Introduction: The Business
McBride has 5 product-focused divisions.

In this analysis I will focus on the first 3 divisions which account for most of the profit and serve the same markets.
McBride's main competitive advantage lies in its scale and manufacturing platform. The company operates as an end-to-end producer, designing its own formulations and transforming raw materials into shelf-ready finished products.
Their in-house capabilities include:
Blow/injection moulding
Liquid and powder mixing
Bottle filling
Capsule forming and filling
Tablet pressing
Powder filling
The company's scale and resultant capabilities are a very important competitive advantage.
Input cost optimisation via custom formulations and material sourcing.
Large production capacity to serve big-box national retailers.
Diverse product offering across multiple categories.
Reduced transportation costs, as liquids and powders are costly to transport due to their weight and volume.
Economies of scale, allowing McBride to produce at lower costs, positioning it as the low-cost supplier in the market and giving it a pricing edge over smaller competitors.
Bulk purchasing power for raw materials.
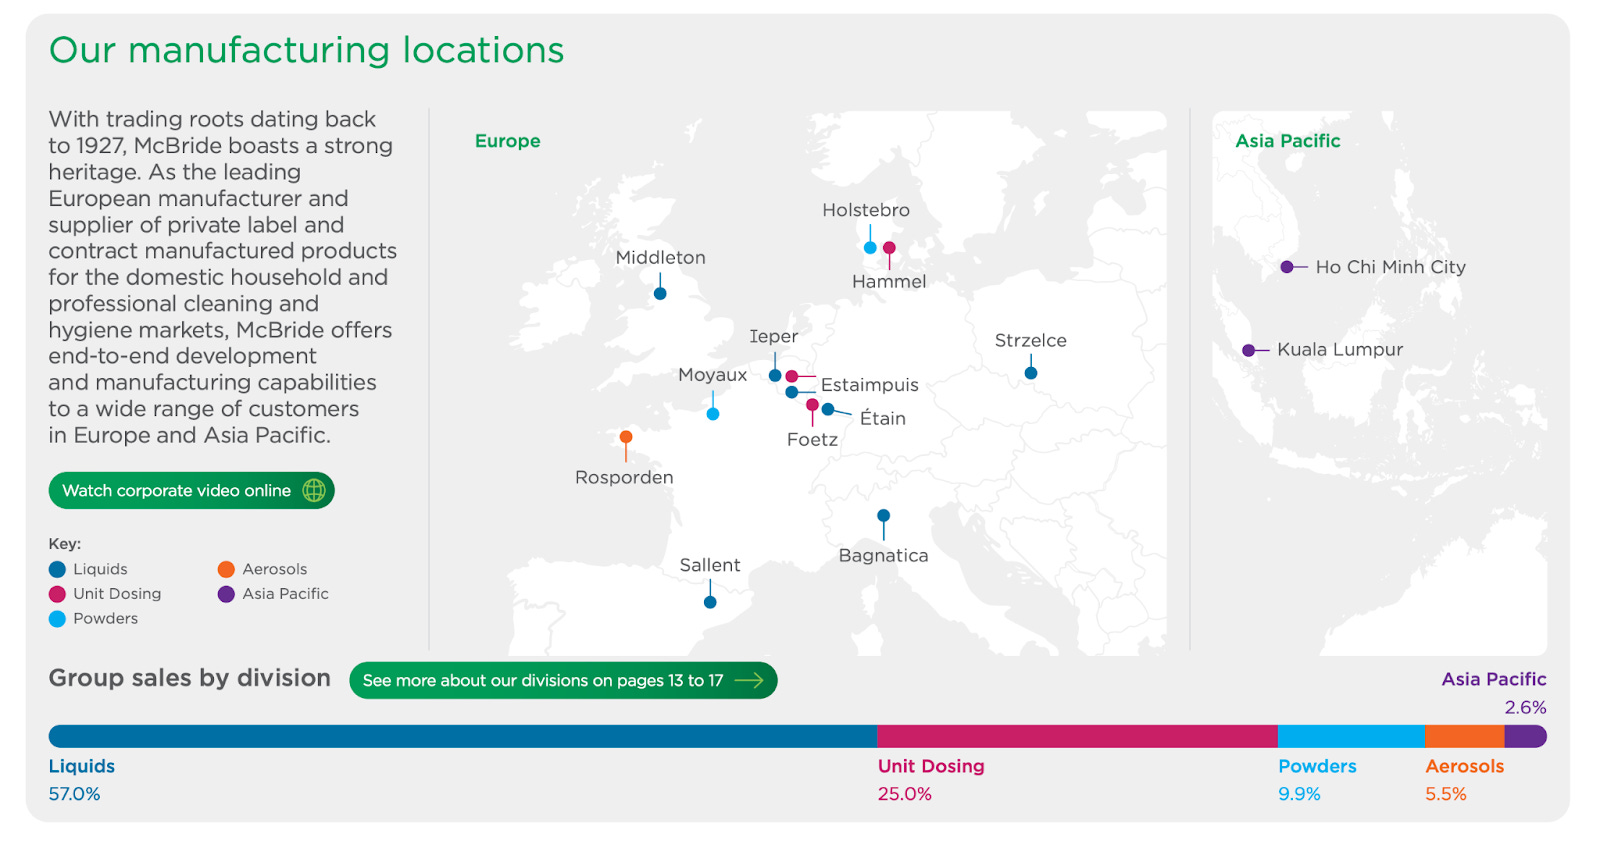
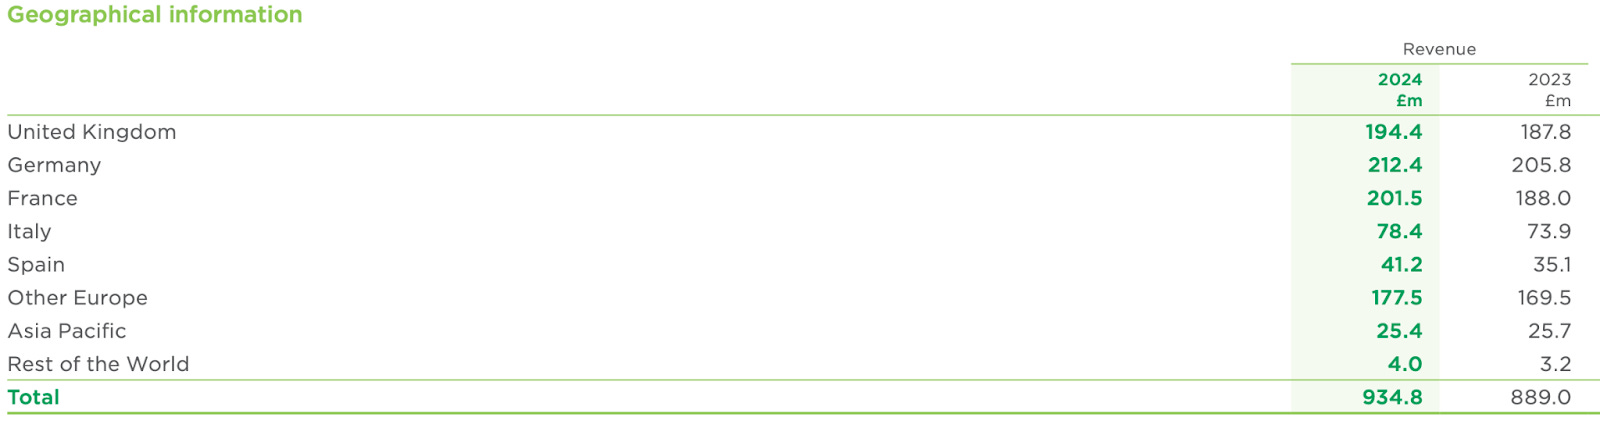
McBride sells its products all across Europe
Recent Update
I believe the following line may have spooked some shareholders—understandably so, given the fiasco of 2022:
‘Input costs for the main raw and packaging materials remain in line with forecasts made at the beginning of the financial year. However, with only four months of the financial year complete, the Group remains cautious about the macro-economic environment and potential increased volatility in commodity markets adversely impacting input costs.’
Raw material costs made up 56% of revenue in 2024.

Here’s a quote from McBride’s website that provides an overview of some of the key inputs:
‘We are one of the largest European buyers for several of the raw and packaging materials that we source, including surfactants, salts, polymers, enzymes, HDPE, triggers and paper packaging. We also buy a broad range of indirect goods and services across our business.’
It’s important to note that McBride manufactures its own packaging. As a result, there are two main classes of costs:
Packaging Costs
Chemical Input Costs
Packaging
Plastic
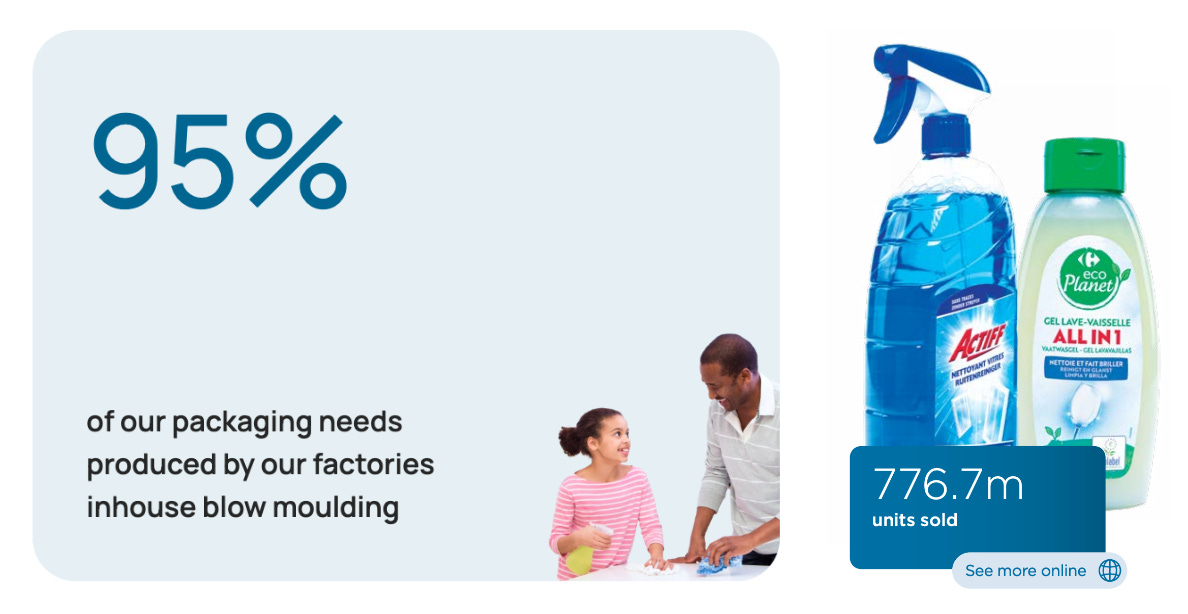
With 715 million liters and 776 million units sold, McBride manufactured 737 million plastic bottles. Assuming each bottle weighs between 60-120g, this amounts to between 44,220 and 88,440 tons of plastic.
‘The main plastic packaging used is PE and PET’ - FY2021 Annual Report.
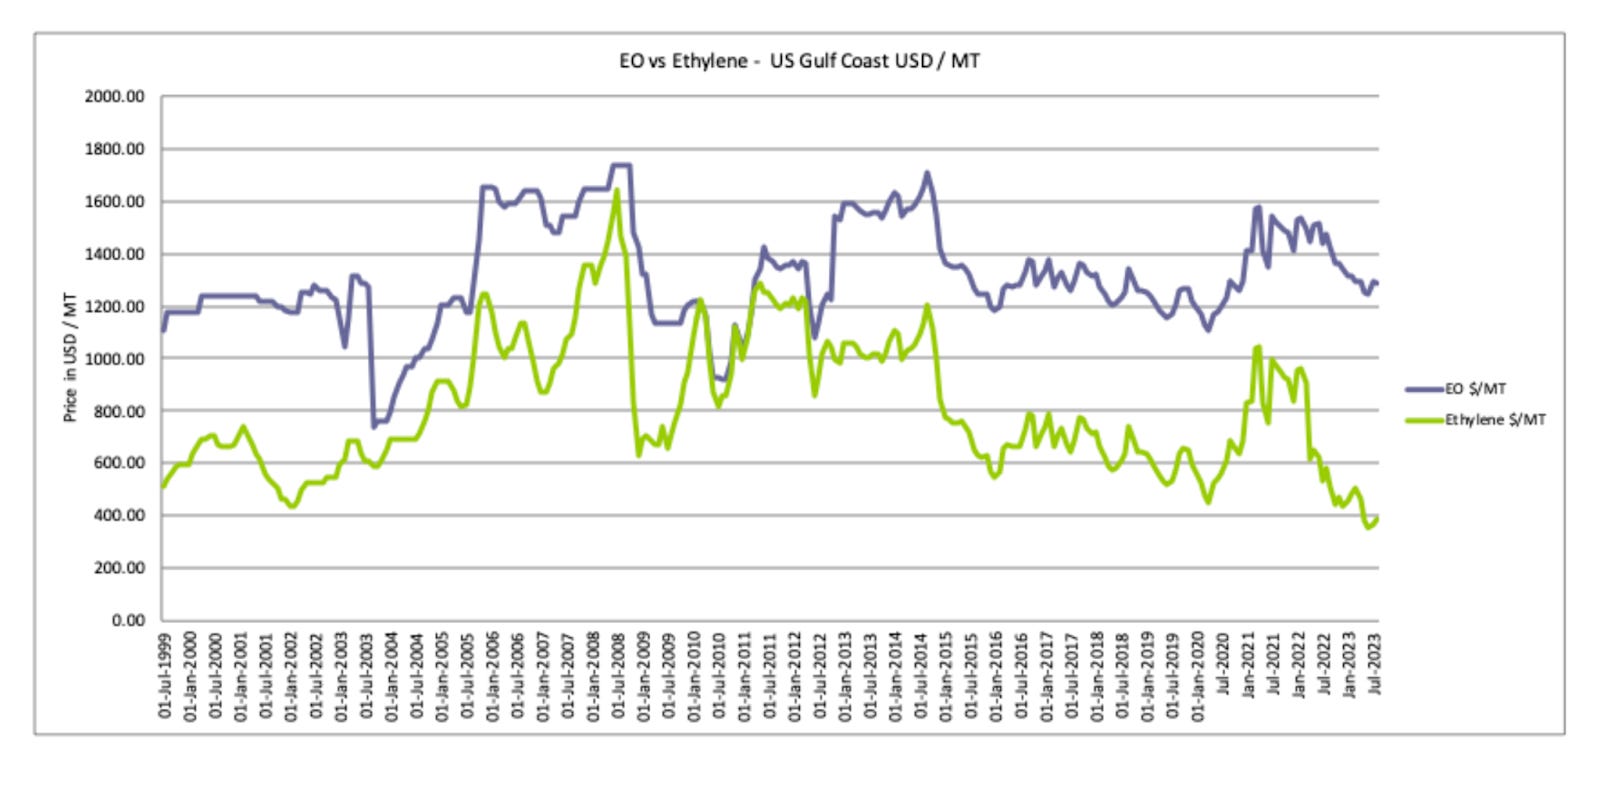
Polyethylene (PE) and Polyethylene terephthalate (PET) are both derived from ethylene. We will encounter ethylene again later on again — so I will go into a bit more detail than perhaps necessary. The 2 primary feedstocks for ethylene are naphtha and natural gas. Plants can be designed to use both.
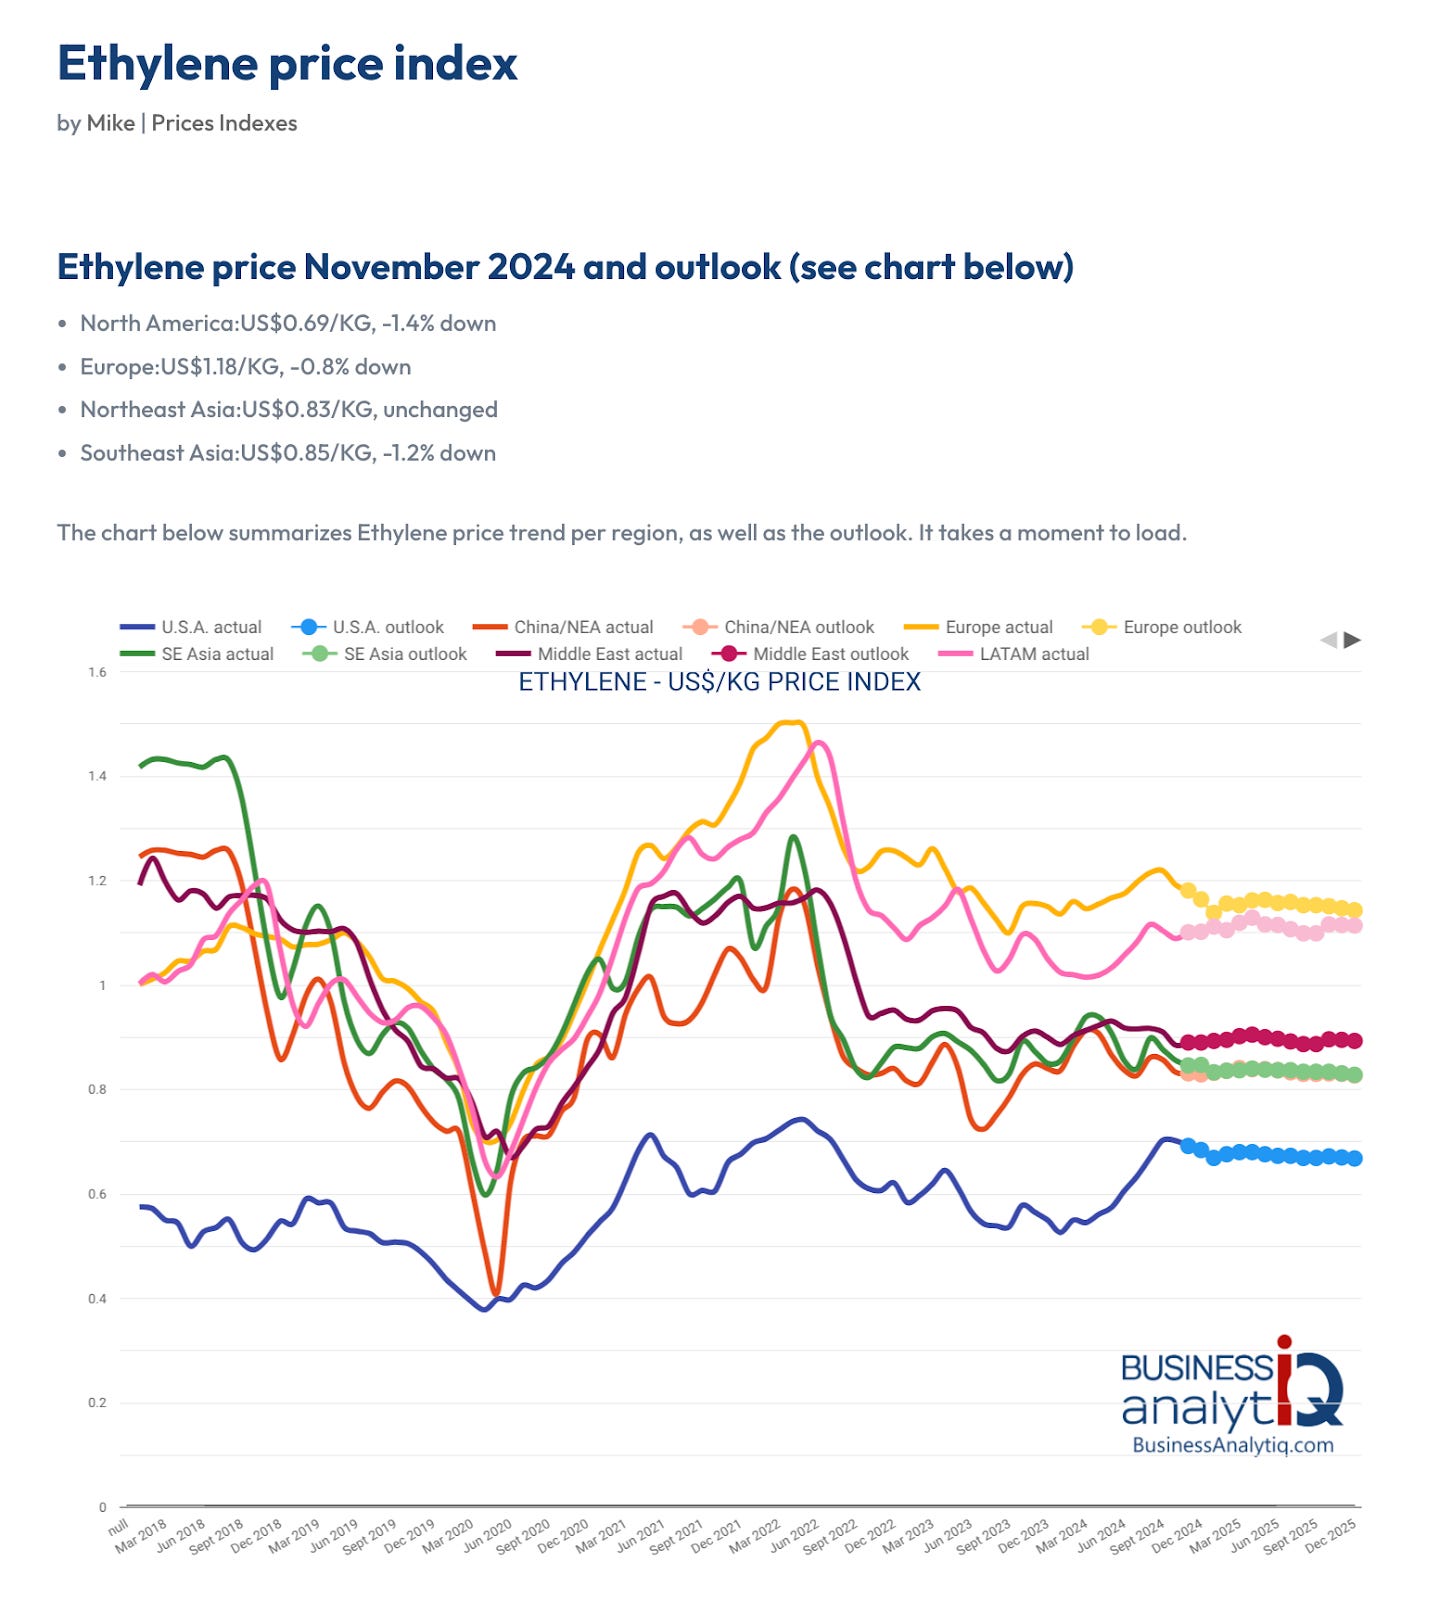
Ethylene prices are unsurprisingly correlated with the prices of Oil and Natural Gas. Prices spiked during the pandemic, and this will be a recurring theme as we examine price charts for various commodities. It’s clear why McBride faced significant challenges during this period.
Notably, ethylene is cheapest in North America, where feedstock is abundant due to the shale revolution. Below is a long-term chart that clearly illustrates the impact of the shale revolution.

The EU, where McBride operates, has to import ethylene directly or feedstock to manufacture it domestically. In the US ethane is the most common feedstock due to availability of Nat Gas whilst in the EU Naptha is more commonly used.
We can see that recently ethylene prices have been stable, especially in Europe, with the recent spike in US caused by hurricane related downtimes: Ethylene spot prices exceed two-year highs on tightened supply conditions | S&P Global Commodity Insights
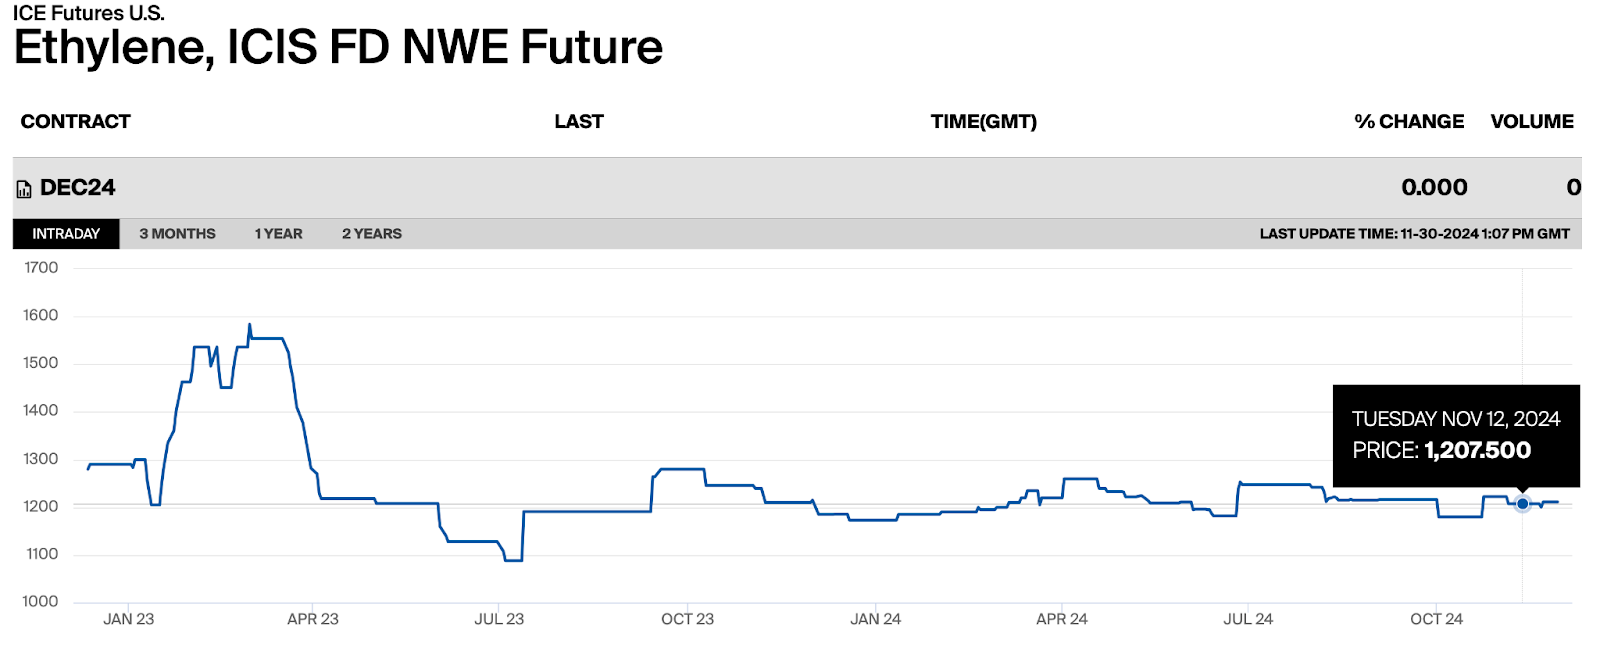
For completeness sake I also looked at European ethylene futures which paint the same picture. This of course is good news for McBride shareholders.
Now lets look at plastic prices directly.
Polyethylene (PE)

Polyethylene terephthalate (PET)
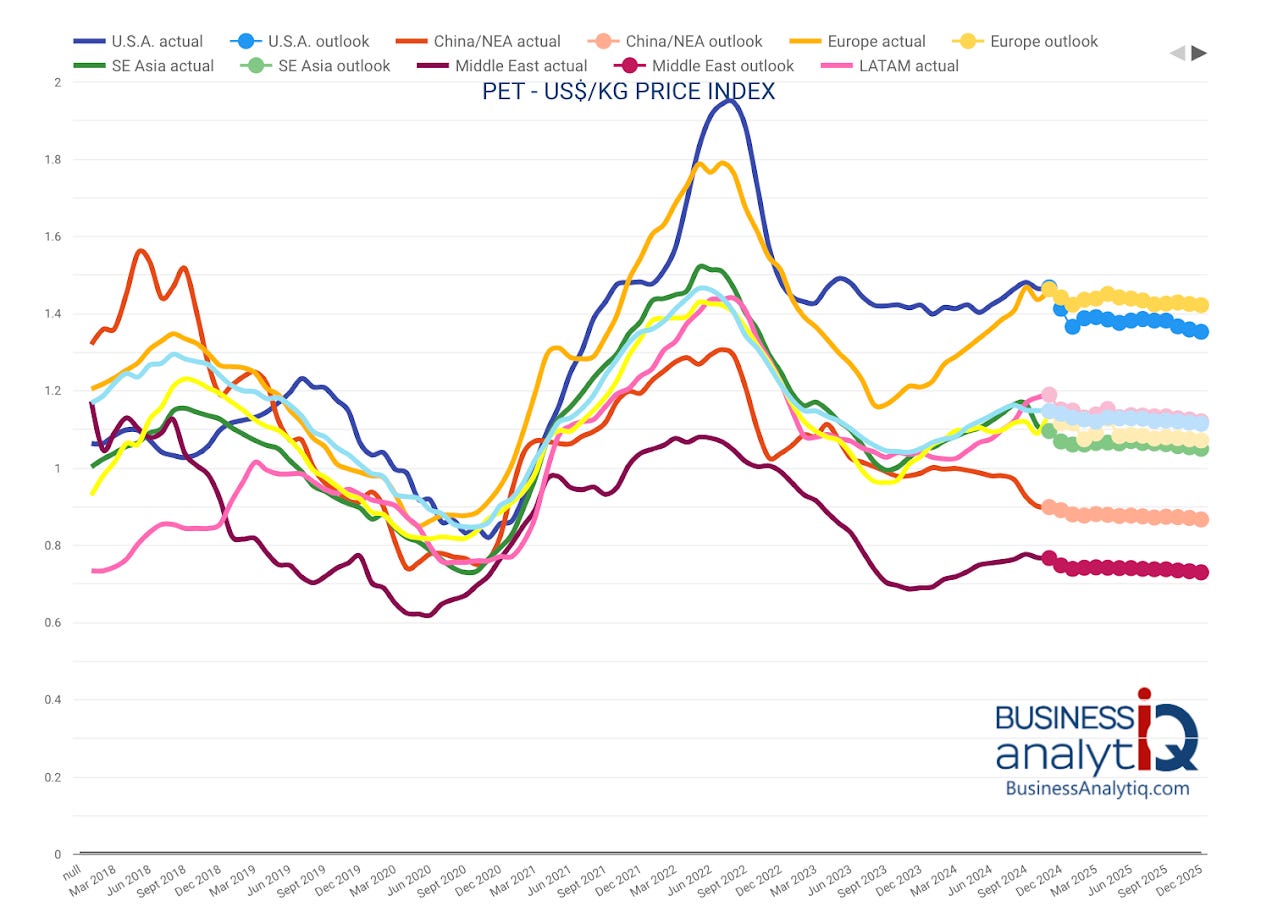
You can find more charts for diffrent grades — such as LDPE or rPET. I have omitted those for brevity.
While there are some variations, all the charts paint a similar picture. After the 2022 price spike, prices have generally come down, though there have been notable increases in recent months. Additionally, it is evident that lighter plastics are cheaper, while recycled plastics are more expensive.
Furthermore, the market is currently in a state of overcapacity, with limited demand due to subdued construction and automotive activity. According to ICIS, capacity is projected to exceed demand by 200 million tons by 2028. Prior to the pandemic, US producers added significant extra capacity, aiming to capitalize on cheap petrochemicals, while China also expanded its capacity to gain more independence in its supply chains. The impact of this additional capacity has been delayed by the pandemic and various shipping crises, which helped prop up prices. It seems likely that, barring a trade war or other black swan events, plastic pricing will remain weak.
Key-Takeaway: Looking at these prices I am content to assume no price impact. 📌
To understand the business’s sensitivity to plastic prices, the table below shows the impact of a 12.5% increase in plastic costs, based on a 50/50 blend of recycled and non-recycled plastics.
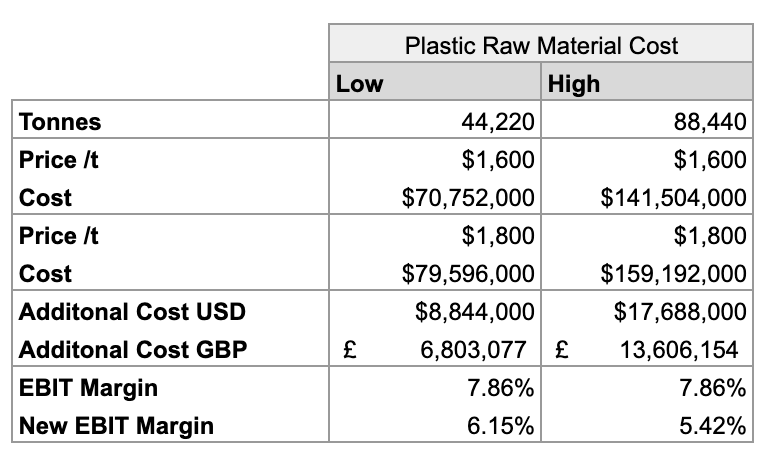
Due to high base costs, even a small change in plastic prices can have a significant impact on margins, whether positive or negative.
Paper
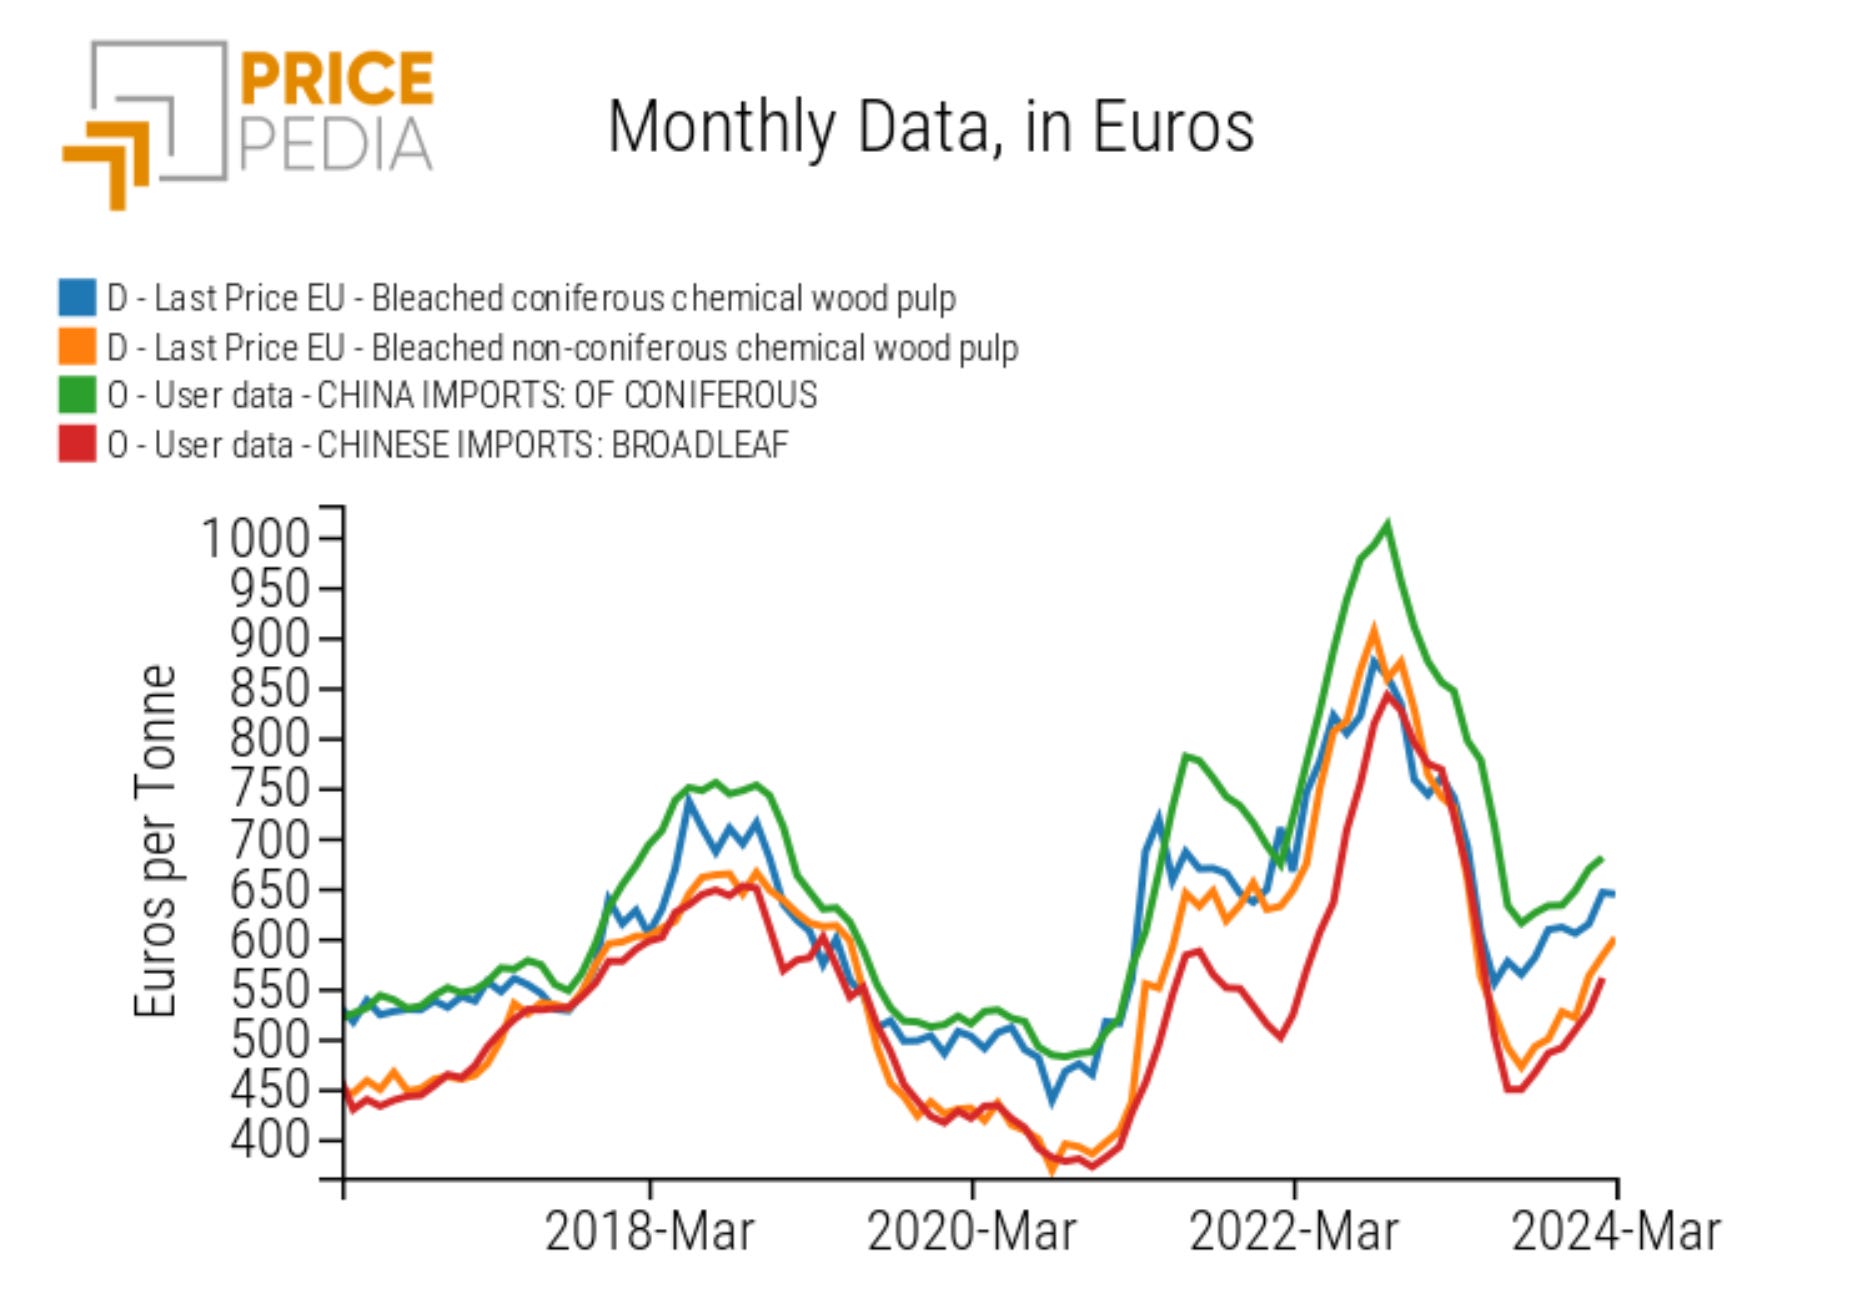
Once again, we see a surge in prices in 2022, followed by a partial reversal. Manufacturing paper is an energy-intensive process, with the pulp-drying stage accounting for 60-80% of a paper mill's energy consumption. As a result, natural gas prices have a significant impact on input costs. Since then, prices have risen by 7%, likely driven by higher European natural gas prices due to cold weather.
Assuming:
Each dishwasher tab box contains 100 tabs and weighs 150g
Each powder detergent box contains 1kg of powder and weighs 150g

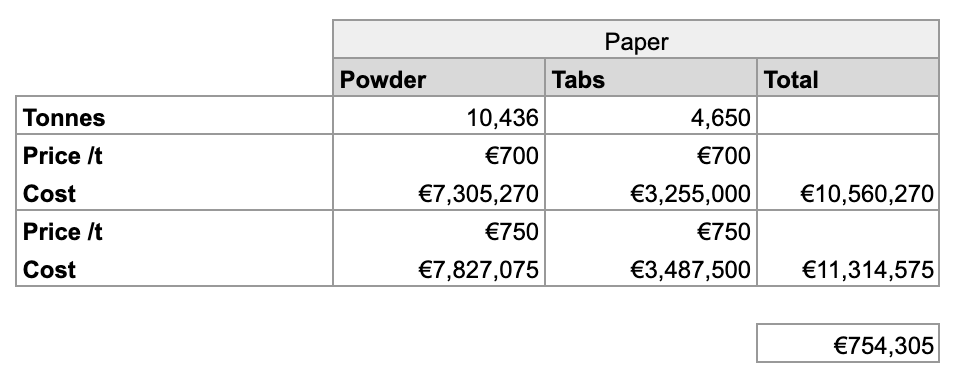
I could be off by a lot here, but the overall conclusion would not change significantly.
Key-Takeaway: Because of a lower base paper costs have less overall impact. 📌
The Chemicals
Before analyzing detergent compositions, it’s important to note that McBride offers thousands of SKUs across multiple categories, with product formulations changing frequently. For example, 30% of SKUs in the Unit Dosing division sold in the first half of FY24 were under a year old. Given this, it's impossible to get a completely accurate picture of raw input costs, but the goal is to gain a general understanding.
Lets get to the fun stuff!
What Are Detergents Made From?
Firstly, it's helpful to categorise detergents into two groups: Powder and Liquid-based.
Powder-based detergents: These include products like laundry detergents and dishwasher tablets.
Liquid-based detergents: These include surface cleaners, dishwashing liquids, and liquid laundry detergents.
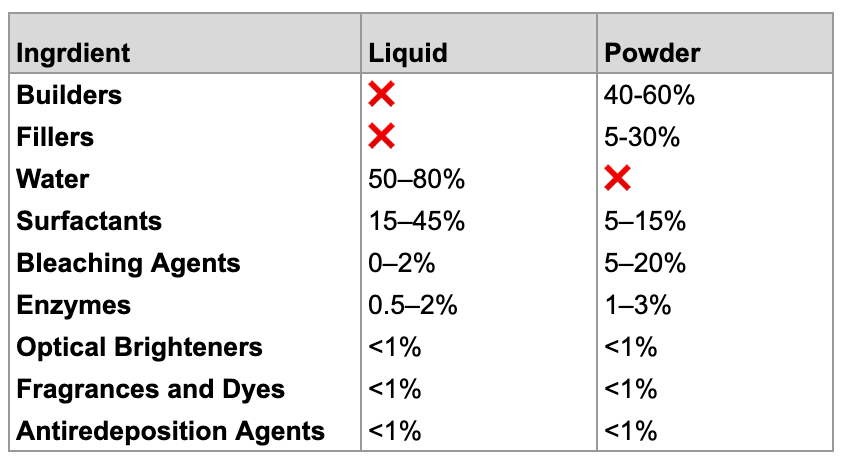
Notice the overlap in surfactants, as this is the main active ingredient category across all detergents. However, by weight, surfactants are not the largest component—builders take the lead in powders, while water is the primary ‘ingredient’ in liquids.
As we are focusing on raw material input costs that drive overall product costs, I will ignore non-core additives that make up less than 2-3% of the overall weight. Tracking down formulations for each of these would be too time consuming. This article took over a month to write as is… so if your enjoying it please…
Builders & Bleaching Agents
These ingredients are relatively inexpensive but are used in high volumes in powder based detergents. I will briefly cover them before moving on to the more exciting world of surfactants.
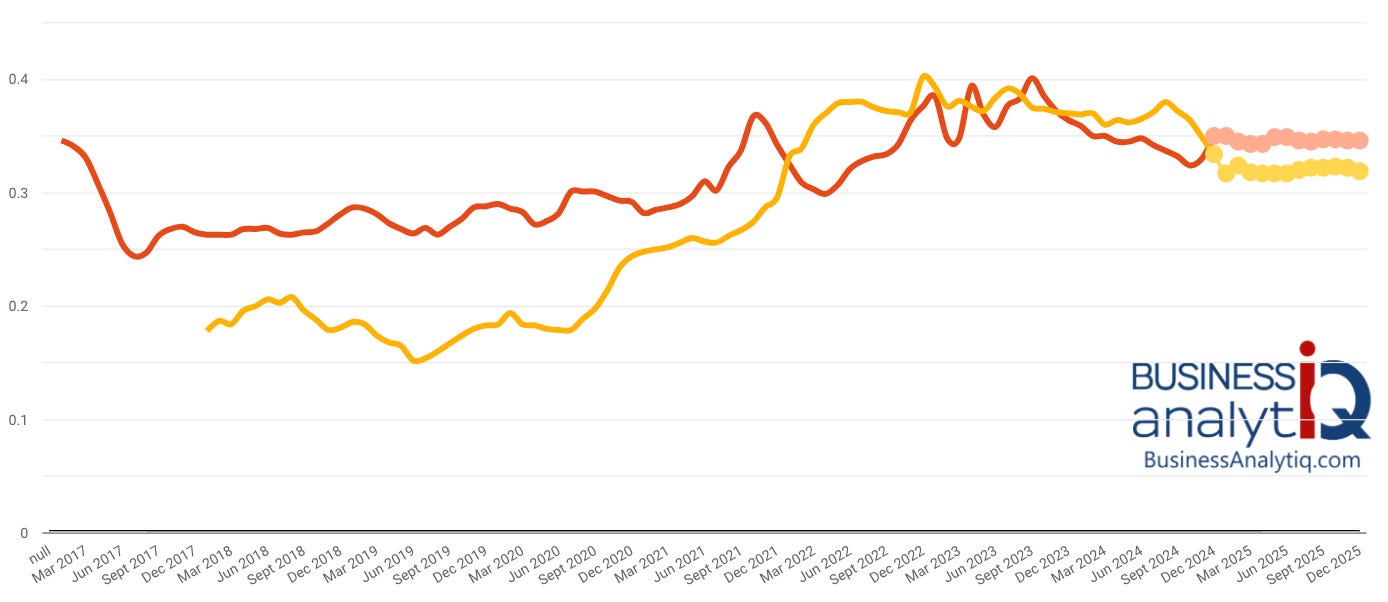
Builders and bleaching agents share a common key feedstock: Soda Ash. It is used in bleaching agents, such as Sodium Percarbonate and Sodium Perborate, and in builders as Sodium Carbonate.
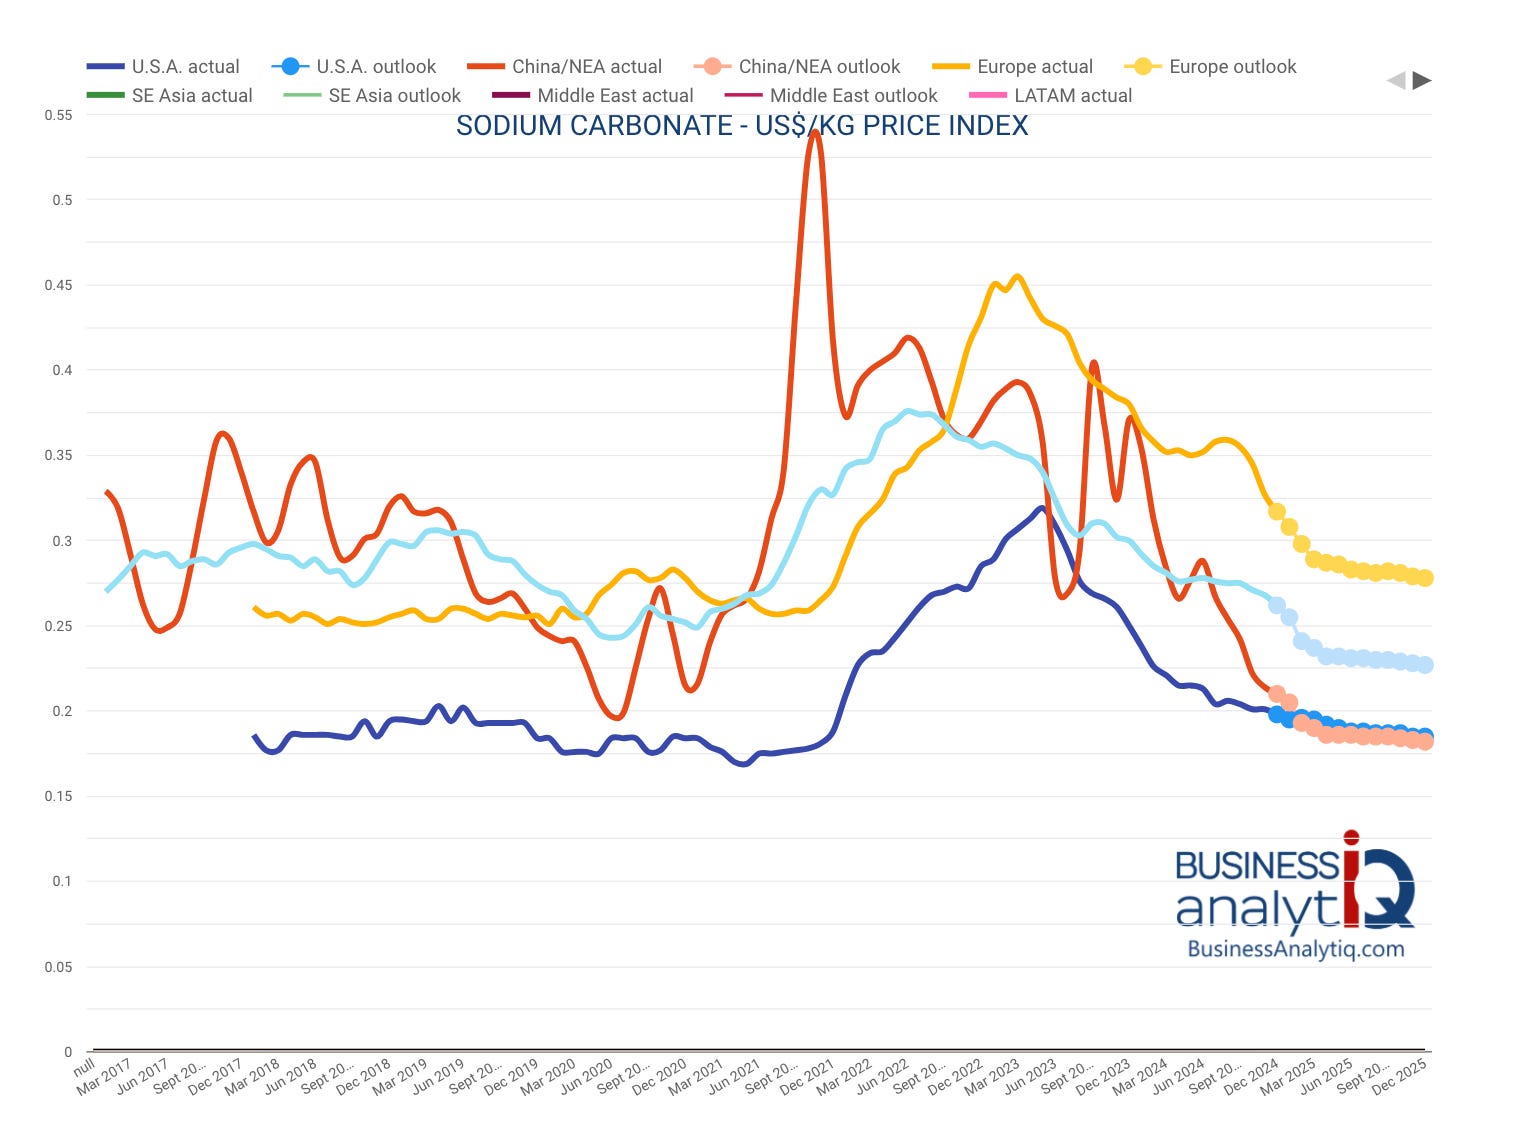
Fortunately, soda ash is an abundant and cheap chemical, and its price has been falling further. Chlorine, another chemical commonly used in surface cleaners and bleaching agents, has also remained flat in price.
Now lets estimate the impact.
Assuming:
3.1 billion dishwasher tablet where each weighs 15g
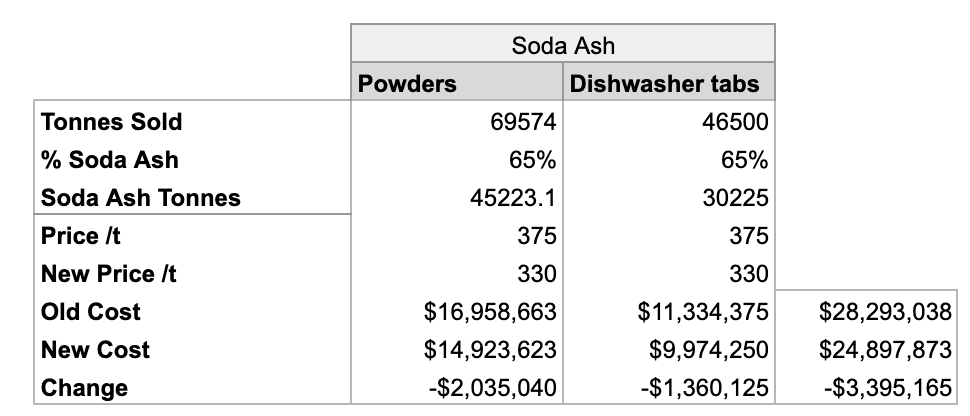
Key-Takeaway: Lower soda ash costs provide some margin tailwind 📌
Surfactants - Surface Active Agents
Surfactants are the main active ingredient in all detergents. These molecules have 2 key parts: a hydrophobic (water-repelling) tail and a hydrophilic (water-attracting) head.

These two components are key to understanding surfactants from a business perspective.
What are the raw materials?
Where are they produced?
What are the supply chains?
What technologies are involved?
For the curious, here is a brief description of how surfactants work.

The water-hating tail binds to non-water substances like fats and oils, while the head remains attracted to water. When enough surfactant molecules surround a dirt particle, they form a structure called a micelle. This allows the dirt to be lifted and carried away by water, effectively cleaning the surface.
What Are Surfactants Made From?
When thinking of the question we need to keep in mind the head and the tail. First I want to review the main categories of surfactants and their roles in various products.
Surfactant Classes & Types
Surfactants can be grouped into 4 classes. Here is a quick summary of their key properties and uses:
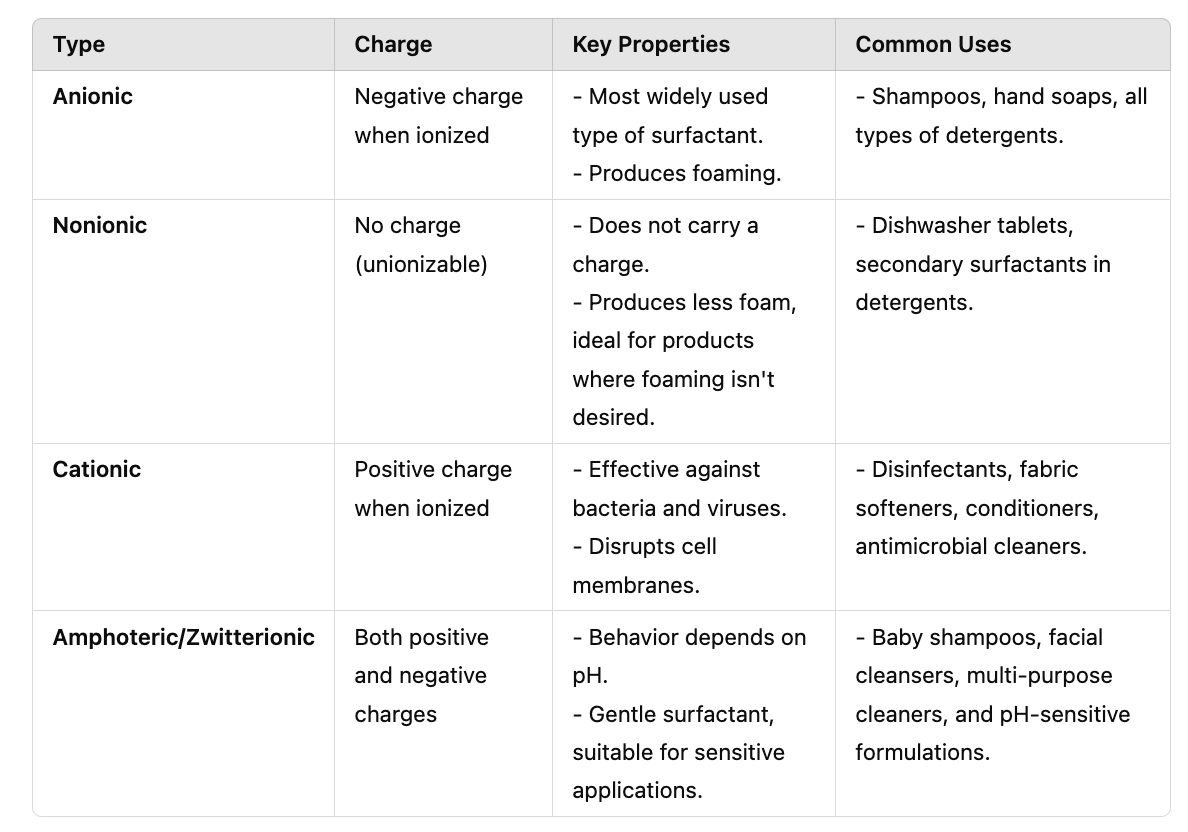
A few key notes:
The first two surfactant types account for the majority of surfactant volume, so I will focus a lot on them.
Combining anionic surfactants with non-ionic surfactants enhances cleaning performance, allowing for lower minimum necessary concentrations.
Nonionic surfactants can be highly effective at low concentrations compared to anionic surfactants and perform well at lower temperatures.
Amphoteric surfactants are almost exclusively used as cosurfactants in dishwashing products, while cationic surfactants are found in cleaning sprays and hair conditioners.
Here is how these classes appear in McBrides’ detergents:
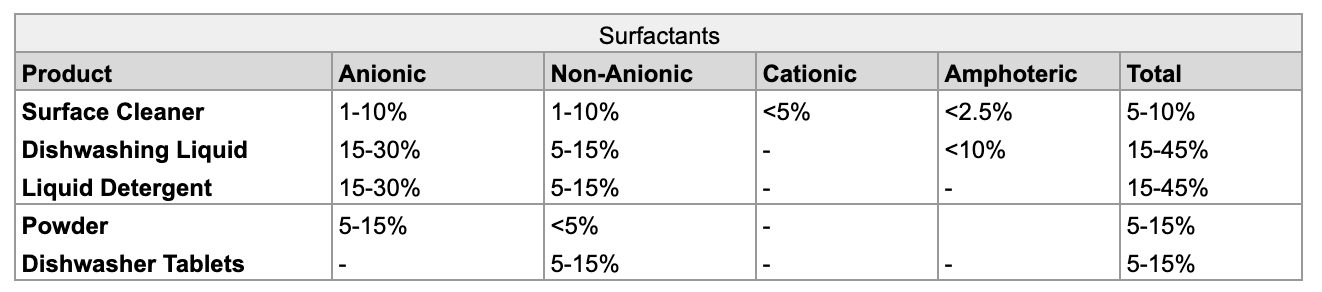
This rough breakdown is based on 50+ McBride Safety Data Sheets reviewed by me. I have included sheets from the UK, Germany, France and Italy in my research. Additionally I reviewed detergents from other brands as a sanity check.
Now let's dive deeper…
Below is an infographic that summarizes some of the more popular surfactants and surfactant categories, as well as the materials and molecules used to form the head and tail. Some, like SLES, frequently appear in McBride's formulations, while others, like LAS, are included due to their significance in the overall market.
The Surfactant Map
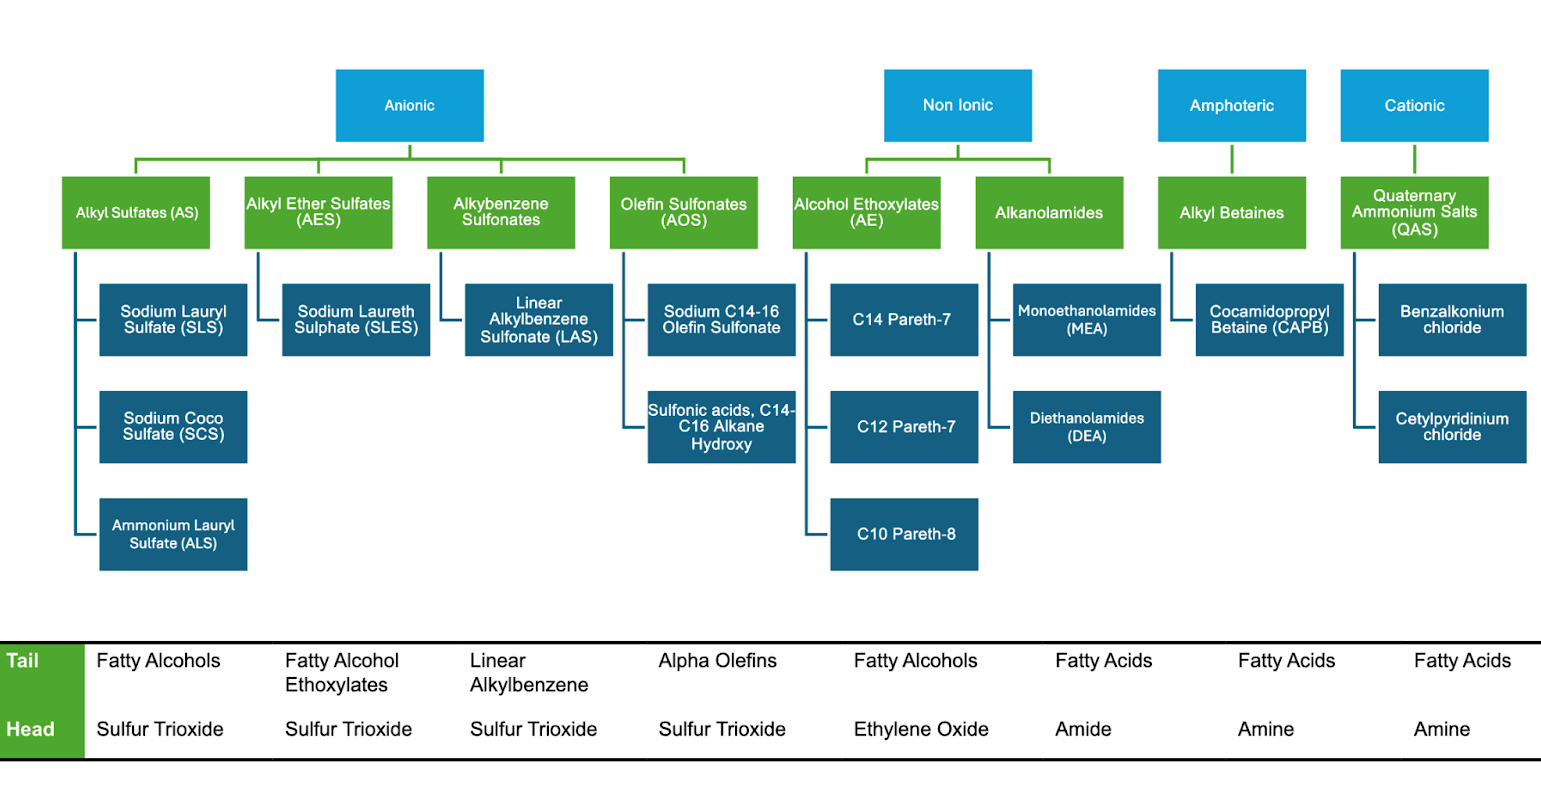
If you look at any shampoo bottle or dishwashing liquid you are likely to find compounds like SLS or SLES. LAS is the largest surfactant by volume, but due to sensitivity to hard water it has slowly declined in popularity, particularly outside of Asia. AOS surfactants are also less popular as they have a number of disadvantages. Amongst non-ionic surfactants, alcohol ethoxylates are the most popular category. CAPB frequently appears as the cosurfactant with SLES and SLS as it enhances many of its properties.
The Head
When it comes to the head there are 3 important feedstocks:
Sulfur Trioxide (SO₃):
Acts as the head group in all anionic surfactants.
It is attached to the hydrophobic tail through a sulfonation process.
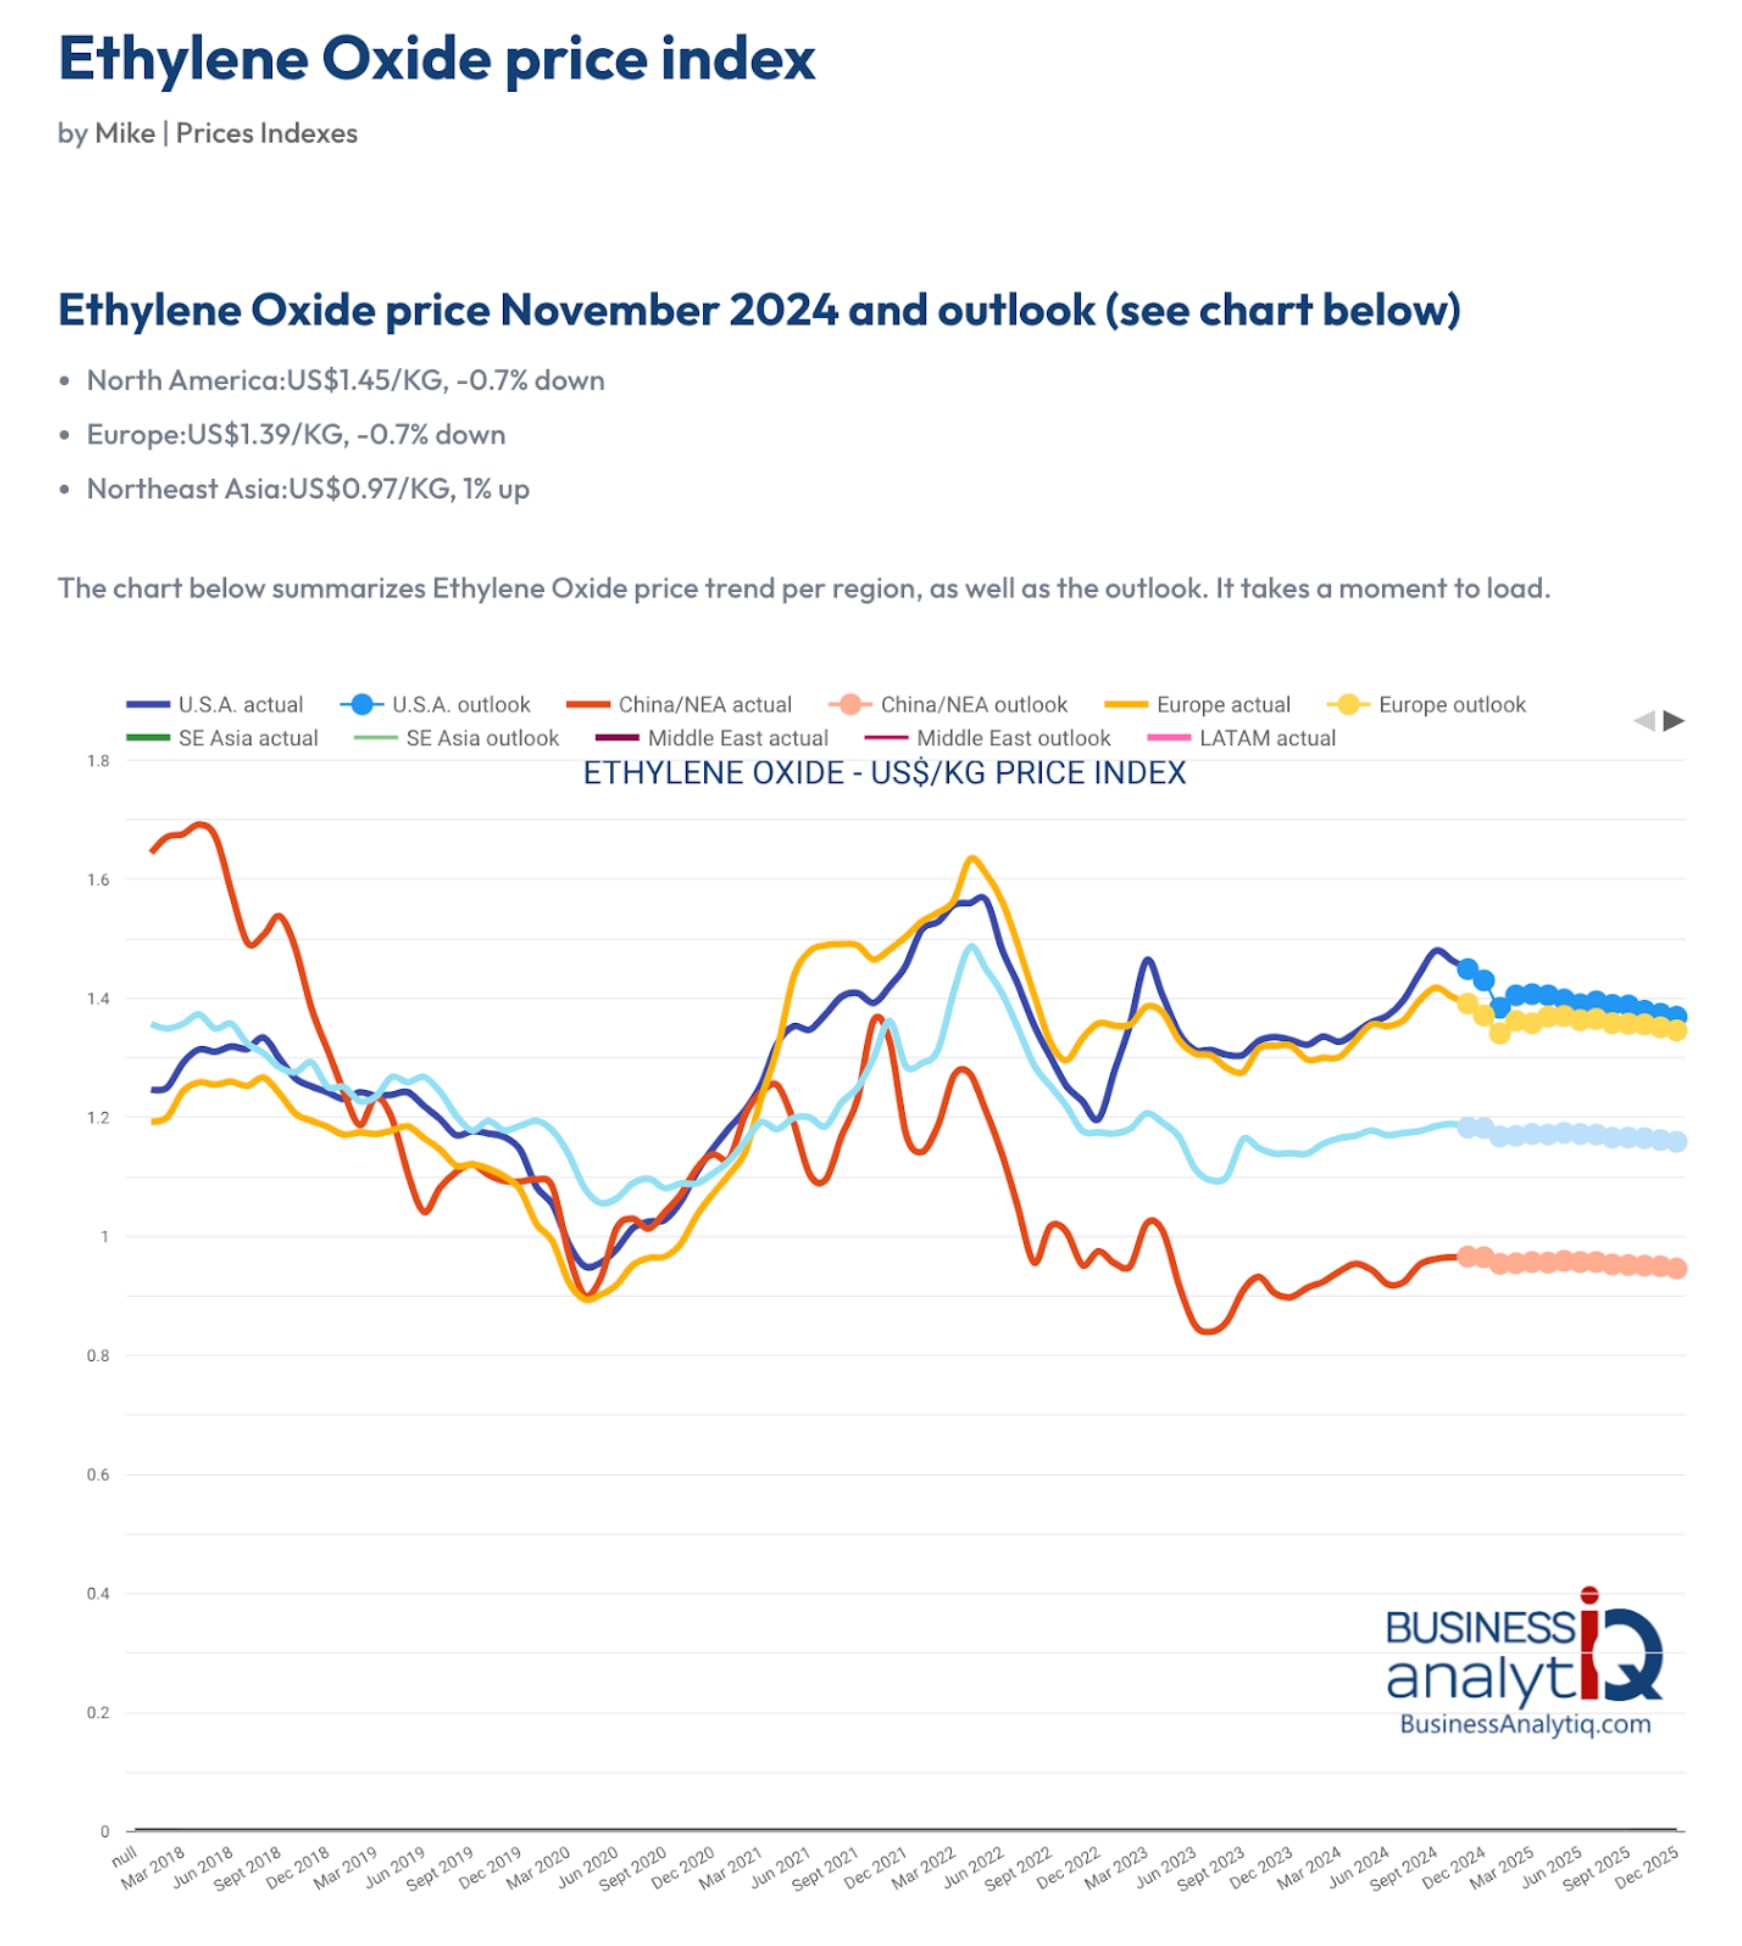
Ethylene Oxide (EO):
Forms the head group via ethoxylation.
Found in SLES (Sodium Lauryl Ether Sulfate), an anionic surfactant, as well as the majority of non-ionic surfactants.
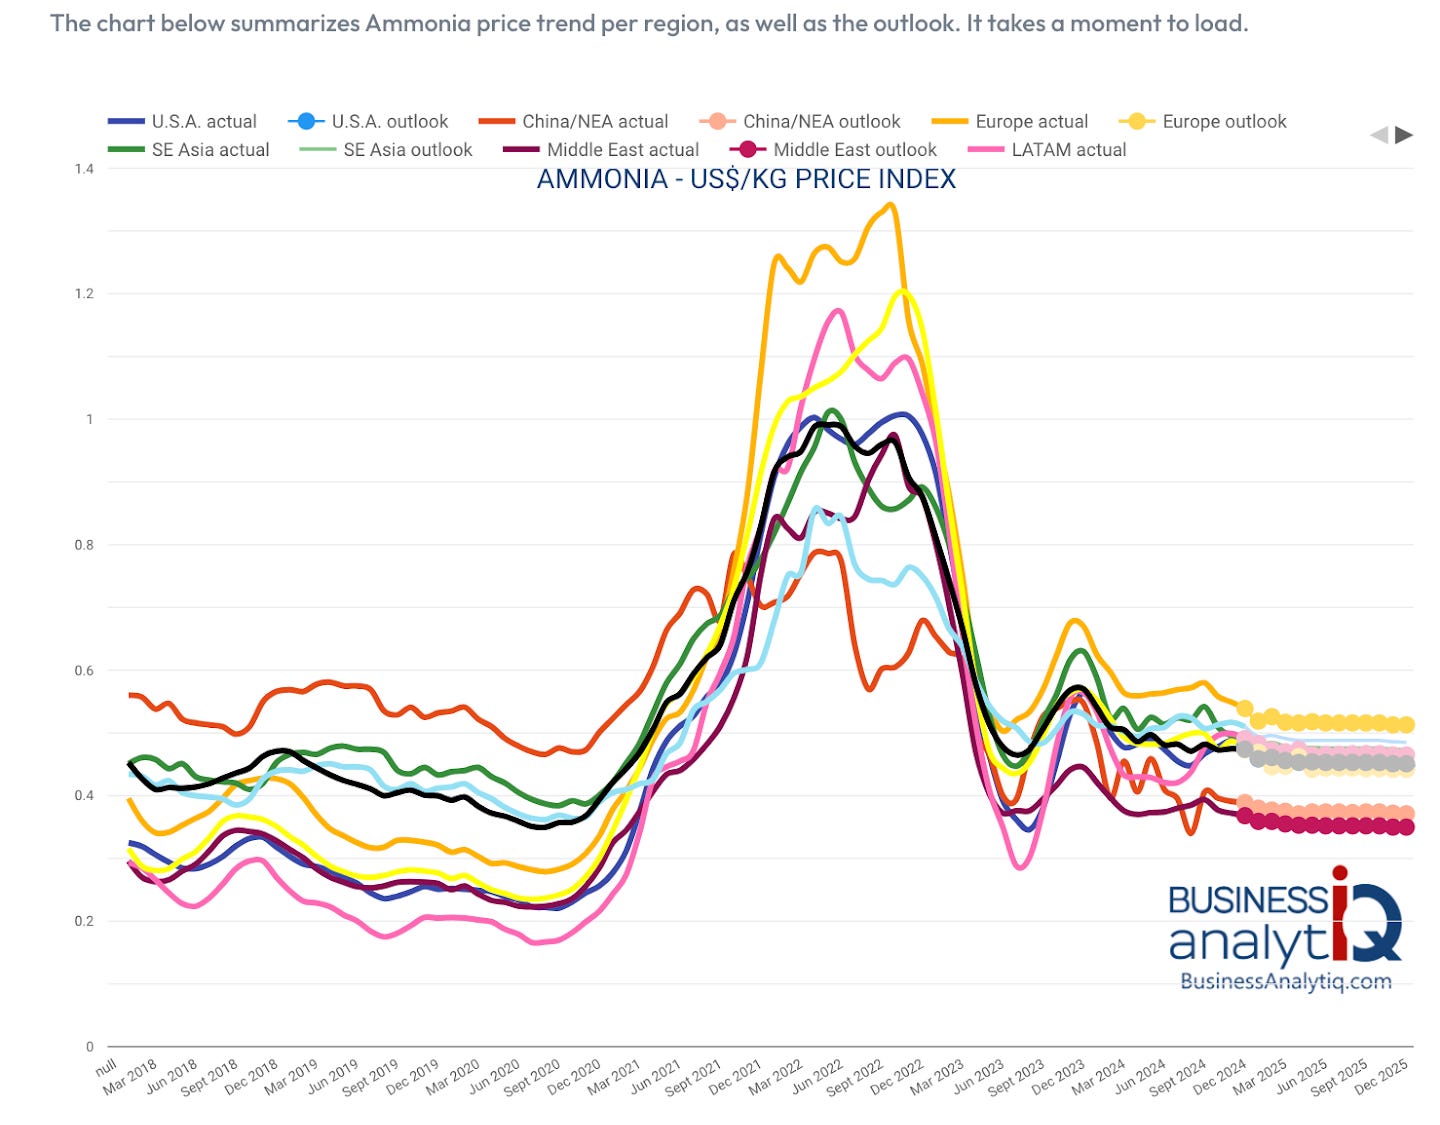
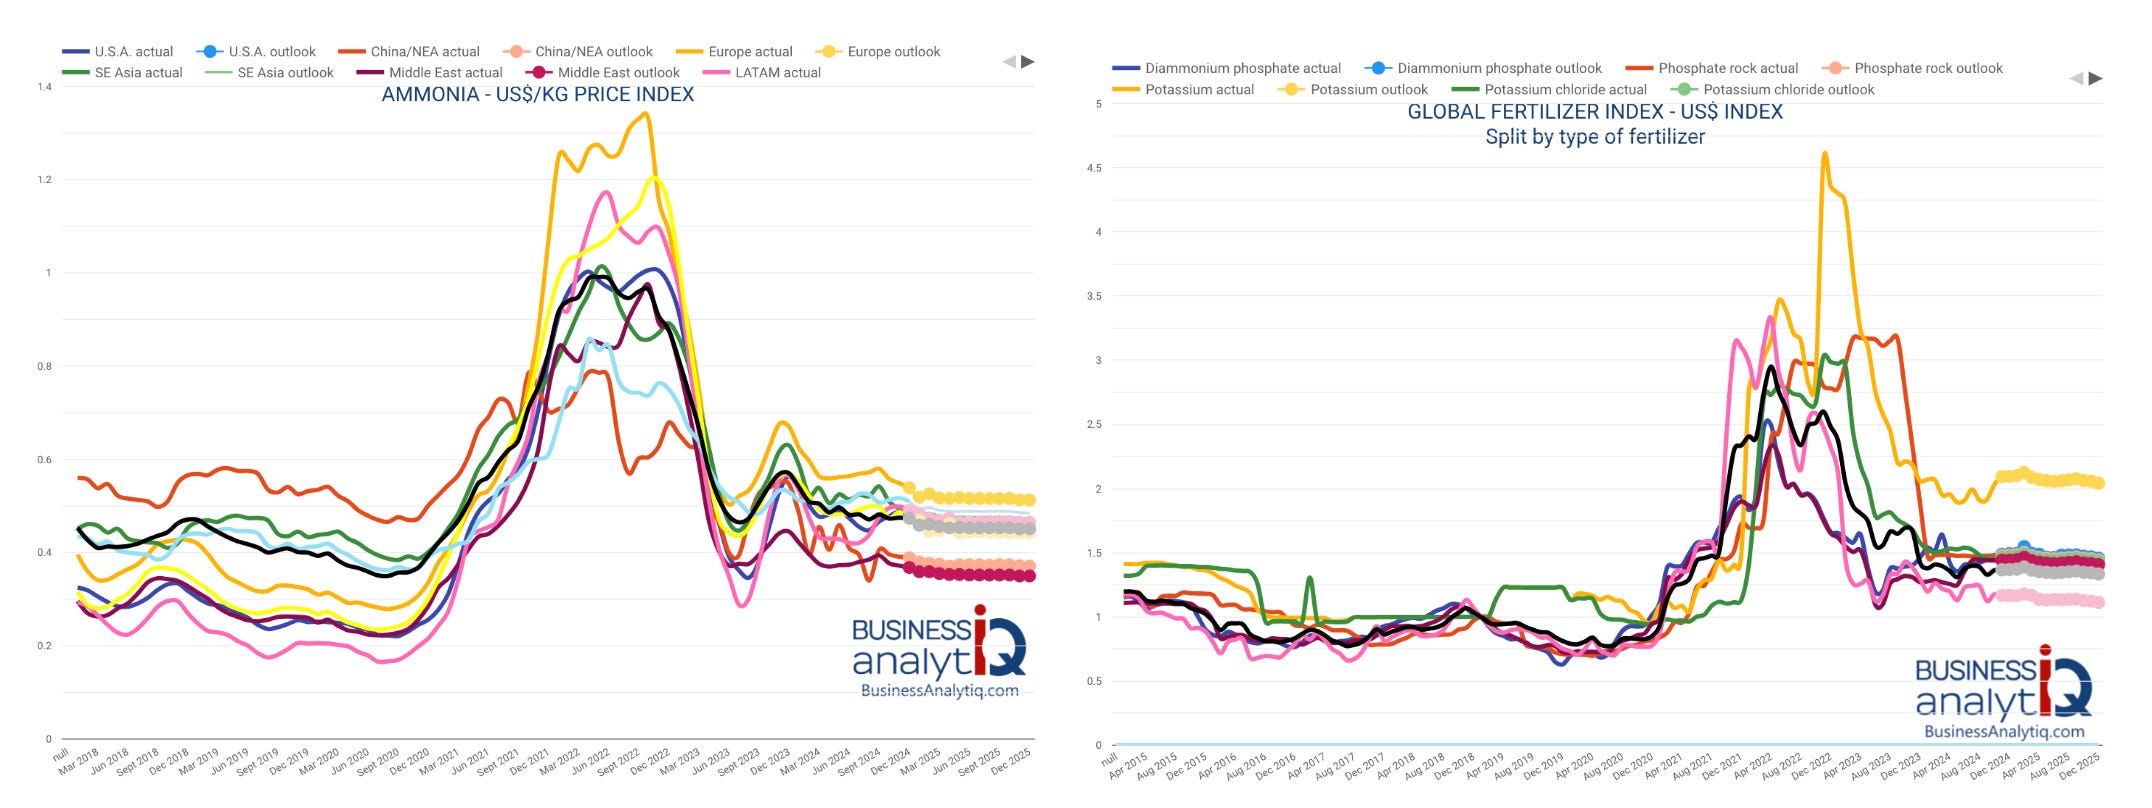
Ammonia (NH₃):
A critical feedstock for producing amides and amines, which are essential for amphoteric and cationic surfactants.
The 3 base chemicals, Ethylene, Sulfur, and Ammonia, are largely derived from petrochemical sources. This is encouraging, as we have seen earlier prices for ethylene have been fairly stable.
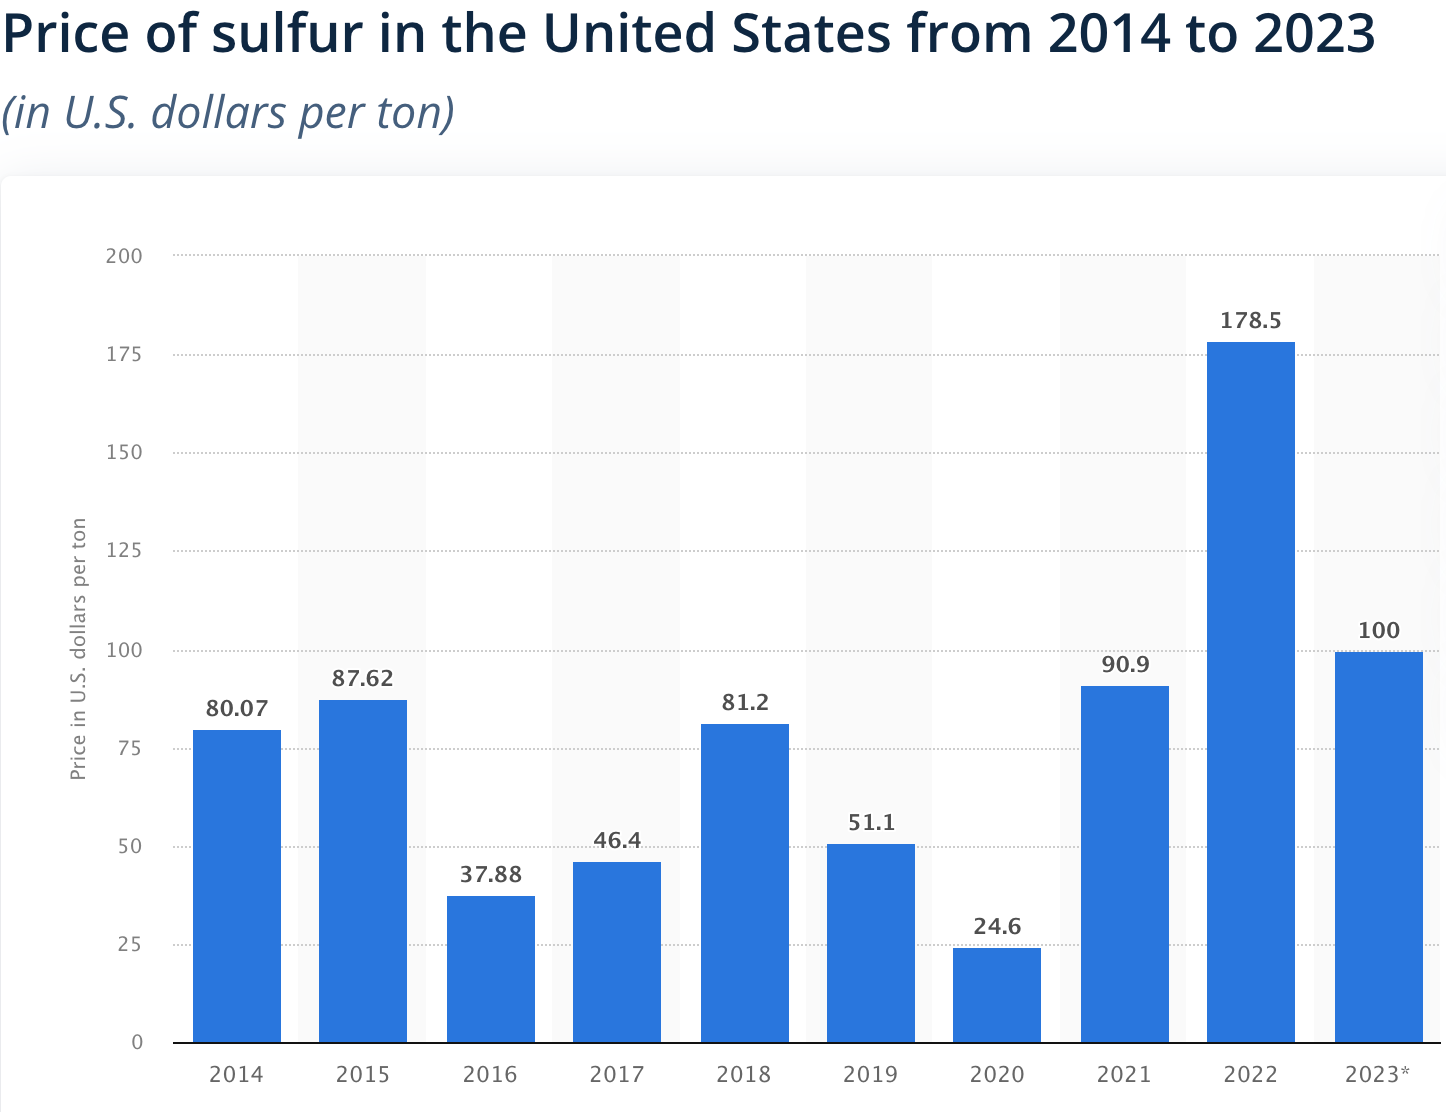
Sulfur is incredibly cheap compared to some of the other chemicals we will look at, only $100 per metric tonne! Ammonia price look mostly flat as of recent too.
The Tail
A Battle Between Oleochemicals and Petrochemicals
The hydrophobic tails can be derived from either oleochemicals (natural oils) or petrochemicals. By far the most popular hydrophobic molecule (at least in Western Countries) is Fatty Alcohol which is used for Alkyl Sulfates like SLS, Alkyl Ether Sulfates like SLES and Ethoxylated Alcohols.
Fatty Alcohols & Oleochemical Building Blocks
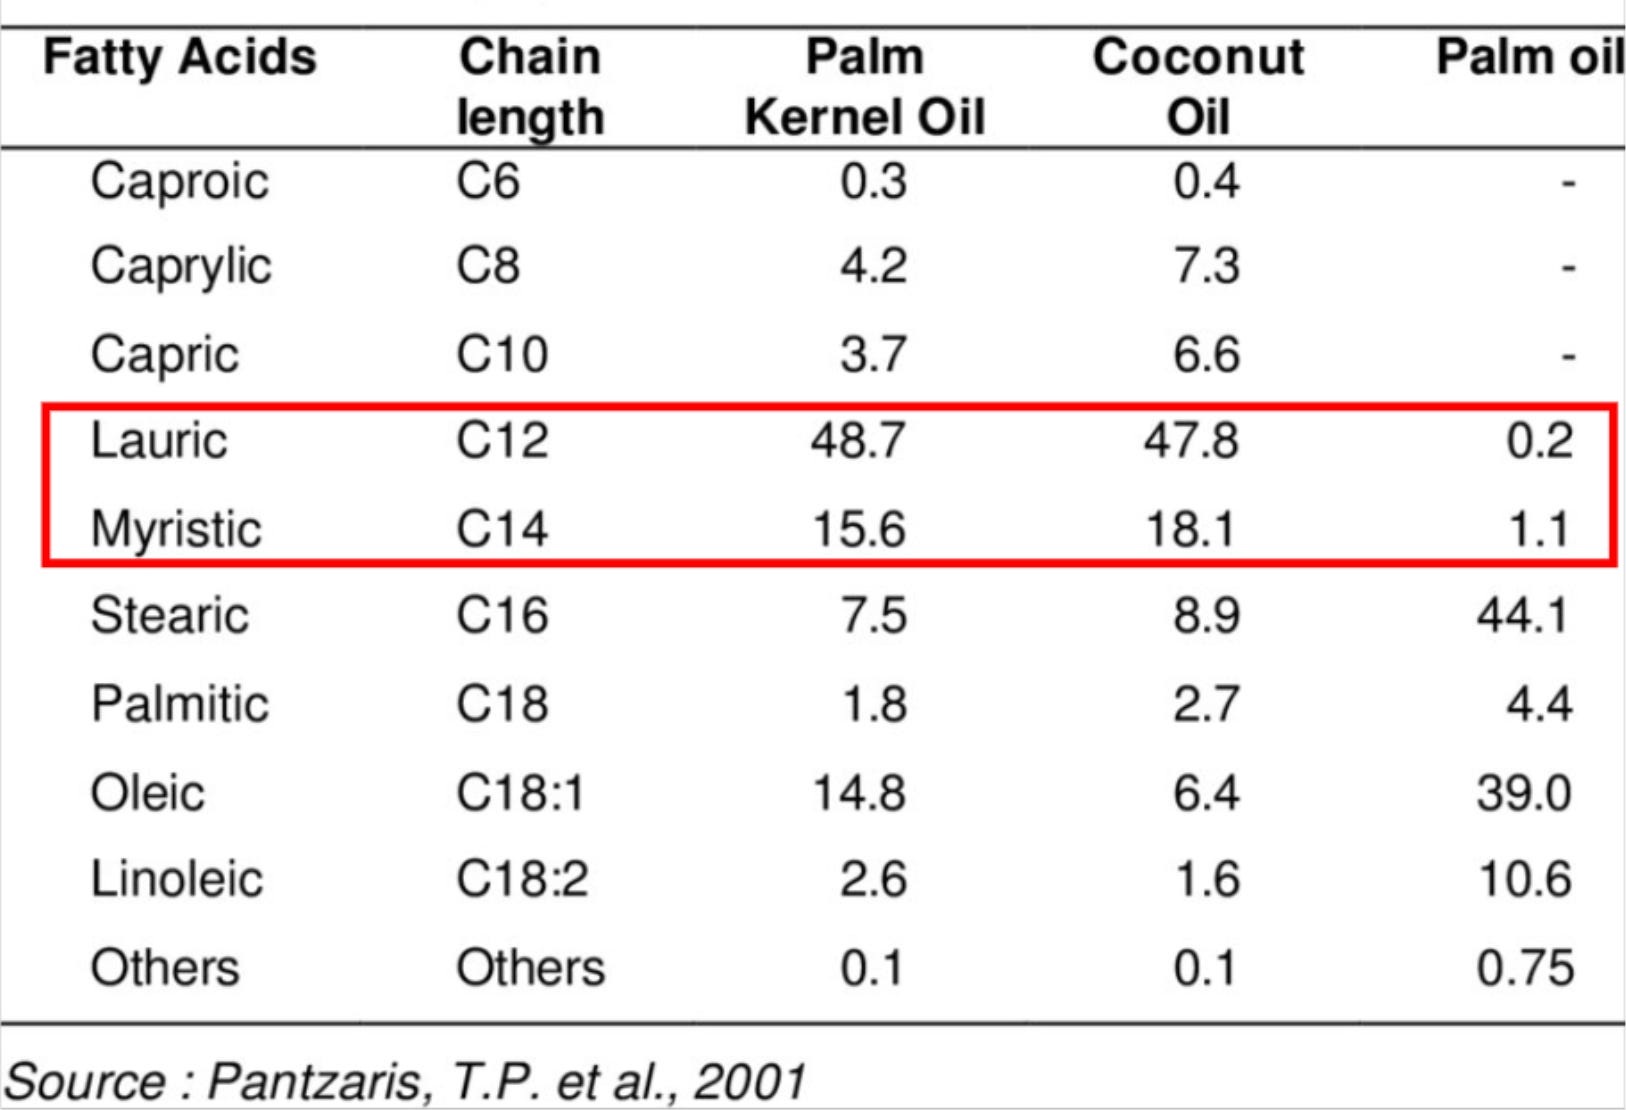
These molecules are usually referred to by the number of carbon atoms in a molecule such as C12 alcohol or C12 fatty acids. C12-C14 (mid-cut) alcohols are used in detergents. They are even referred to as detergent alcohols since 95% go into producing surfactants.
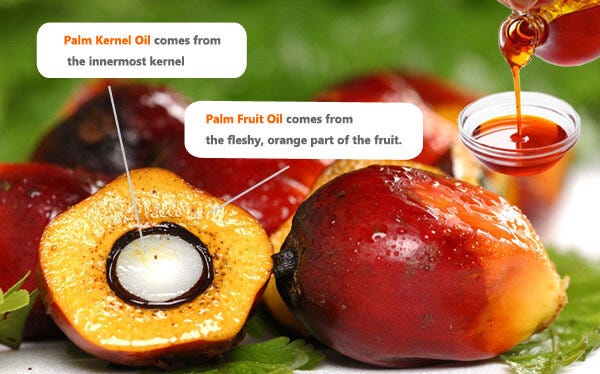
Detergent range fatty alcohols can be produced from Coconut Oil and Palm Kernel Oil (PKO). As you can see from the table below, the high concentration of C12-C14 fatty acids in these oils makes these raw materials especially well-suited for detergent production, unlike Palm Oil.
Fatty acids and fatty acid methyl esters serve as precursors to fatty alcohols. As we saw in the Surfactant Map, whilst most surfactants are manufactured from fatty alcohols, these precursors are also key building blocks for amphoteric, cationic, and certain non-ionic surfactants. The diagram below provides an overview of how these base oleochemicals relate to one another.
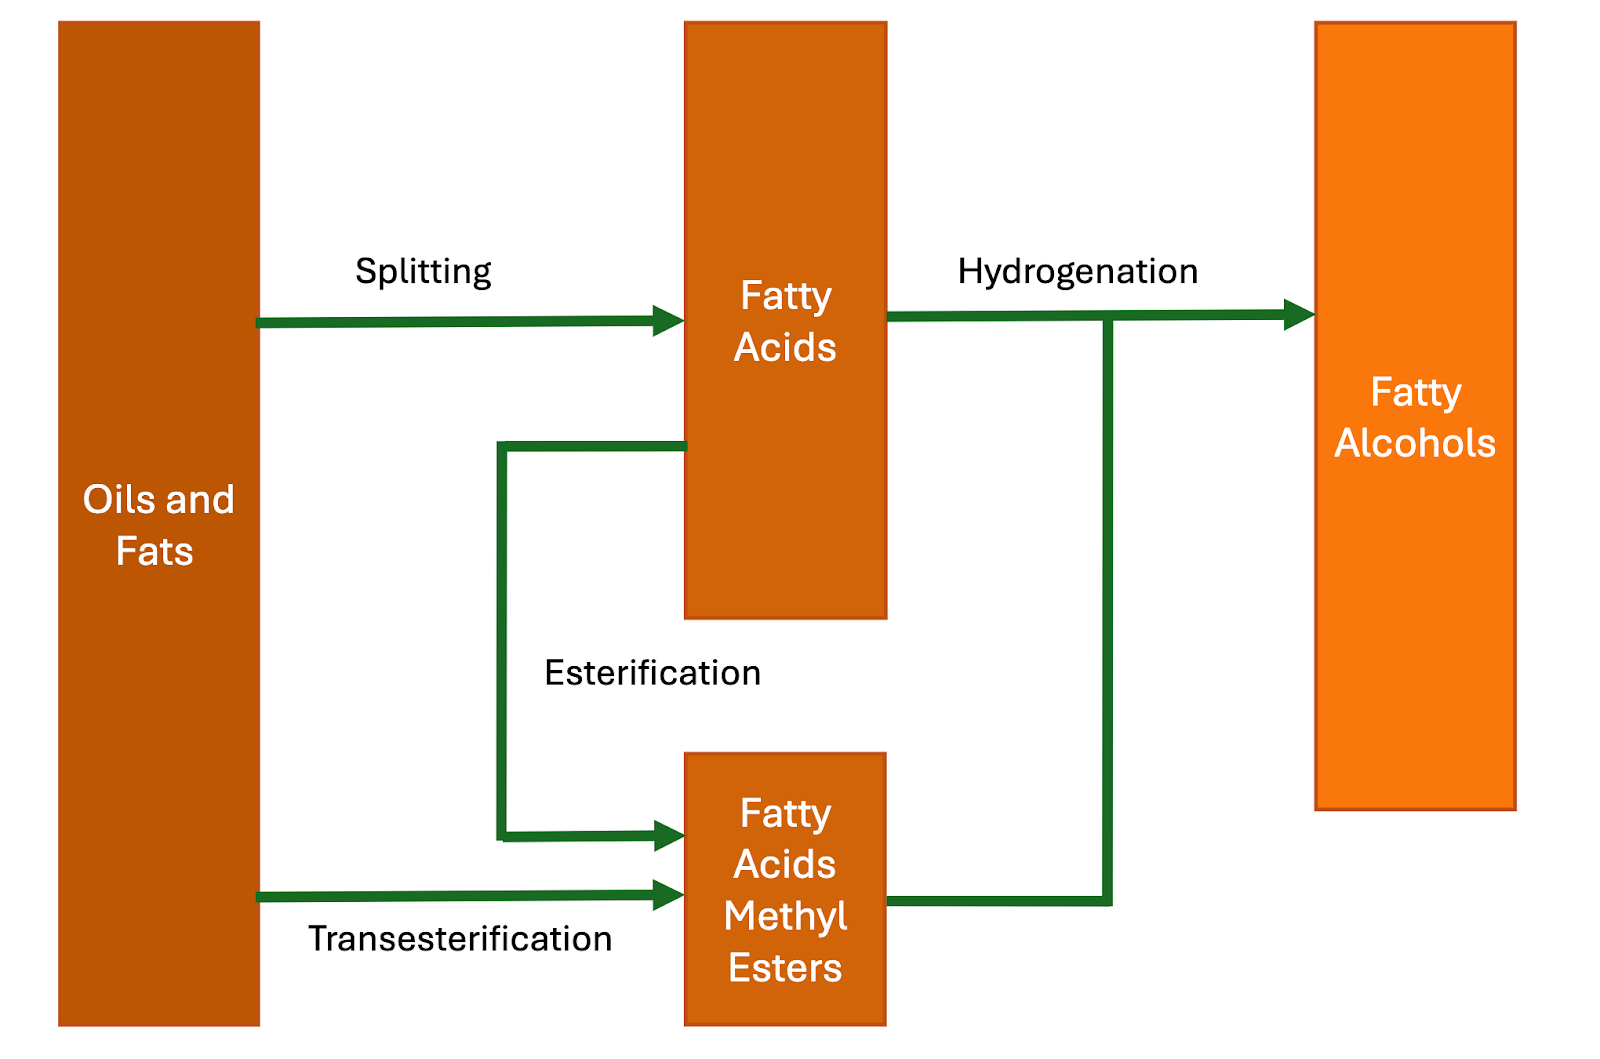
The key point is that they are all interconnected, and as a result, their prices are similar and move together.
Synthetic Fatty Alcohol & Petrochemical Hydrophobes
However Fatty Alcohols can also be derived synthetically from ethylene via the Ziegler process or via the Oxo process from Alpha Olefins. Alpha Olefins themselves are typically made from ethylene through the SHOP process.
This is the 3rd time we encounter ethylene! Did I tell you its referred to as the world’s most important chemical?
For surfactants made from Fatty Alcohol like SLS or SLES it is impossible to tell from a safety data sheet if natural oil was used as the feedstock. One clue lies in carbon chain patterns: Odd-chain fatty alcohols like C13 or C15 are not common in nature. Therefore odd-chain alcohols indicate synthetic origins - specifically from the Oxo process. However, the opposite does not hold true, we cannot state even-chain alcohols (e.g., C12, C14, C16) are necessarily derived from natural sources - the Ziegler process produces even-chain alcohols making them ideal substitutes. This has implications on the assumptions we can make at the modelling stage.
Petrochemical Hydrophobic groups include: Alko Benzene, Alpha Olefins and Synthetic Fatty Alcohols.
Alkylbenzenes or Linear Alkylbenzens (LABs) are derived from benzene and are sulfonated to produce LAS.
Alpha Olefins are typically made from ethylene through the SHOP process.
Synthetic Alcohols are derived from ethylene via the Ziegler process or via the Oxo process from alpha olefins.
For a long time petrochemical sources have been the top source for surfactant feedstocks. However, the rise of palm plantations has significantly altered this balance of power…
Surfactant Feedstock Prices
Palm Oil Production
Palm oil is produced tropical areas. 85% of it comes from just 2 countries.
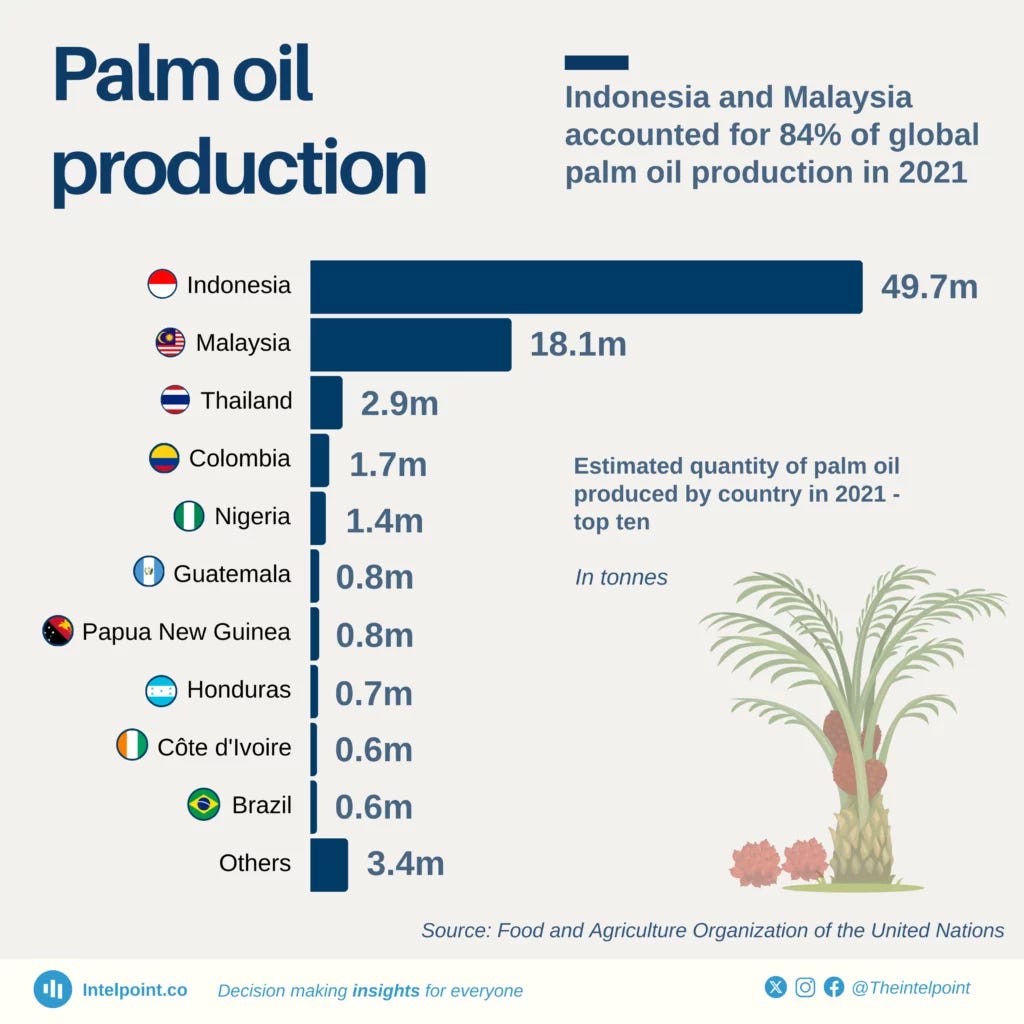
Supply of Palm Kernel Oil (PKO) is more constrained than that of its more famous counterpart. For every 9 tons of Palm Oil there is only 1 tonne of PKO. PKO is a by-product of palm oil.

Palm Kernel Oil & Coconut Oil Prices
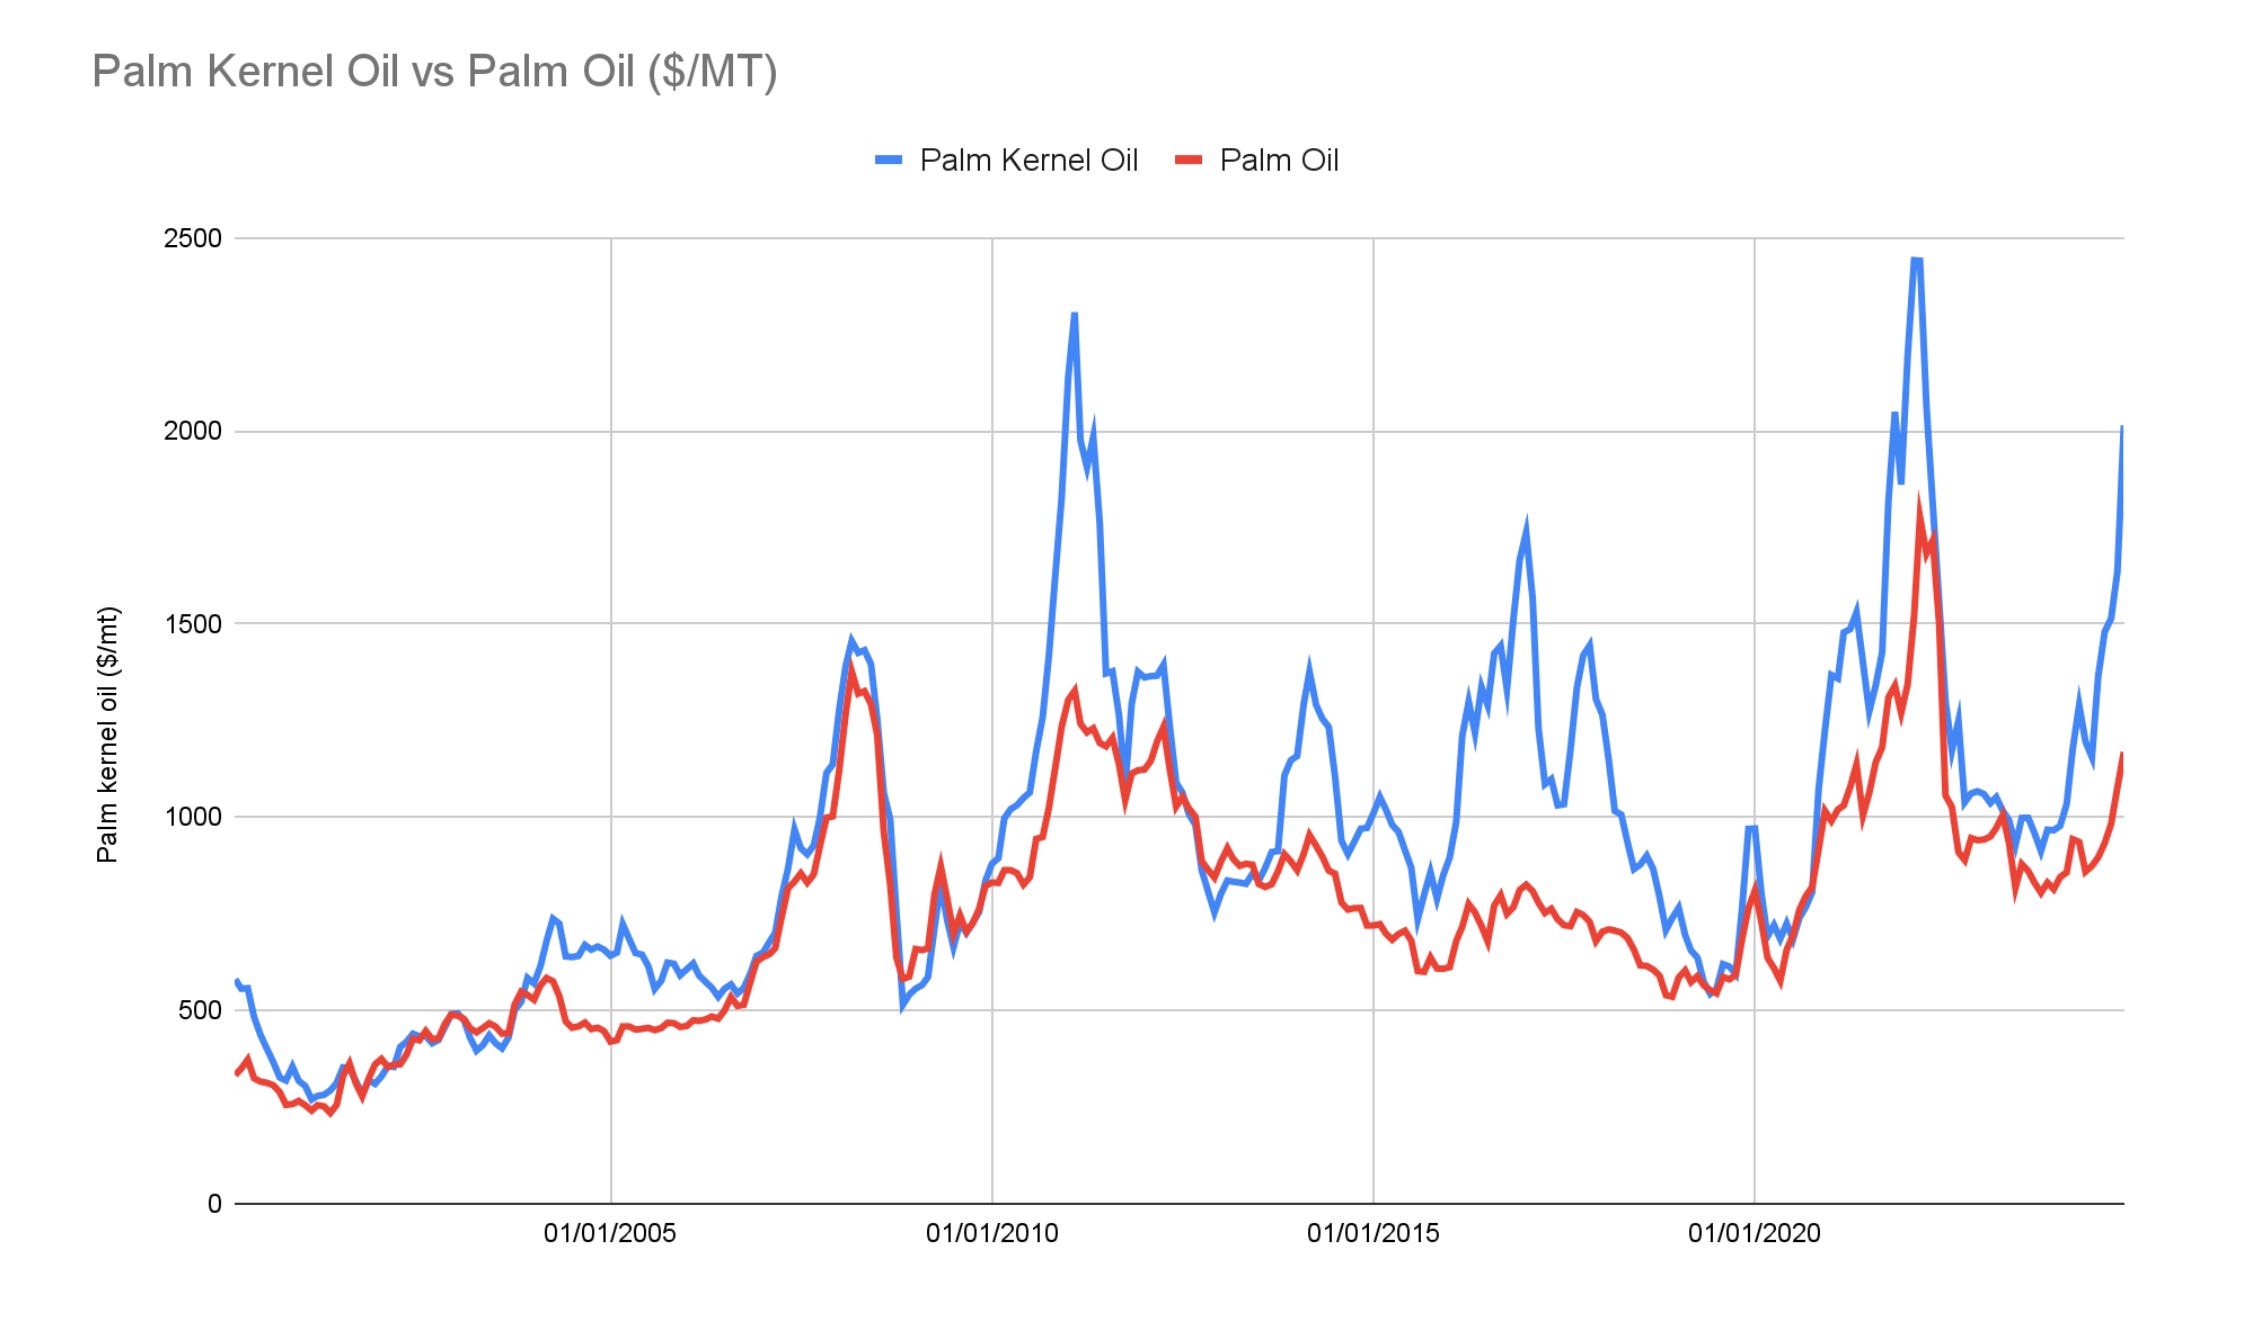
In the previous section we found out that Palm Kernel Oil (PKO) as opposed to Crude Palm Oil (CPO) is used to make detergent alcohols. Turns out it’s a non-trivial distinction. Whilst prices are correlated, PKO is generally more expensive and much more volatile.
Martin Herrington, President of North America at IP Specialties, explains this phenomenon best:
“Producers plant for palm oil, not PKO,” Herrington said. “Therefore, prices for PKO are more volatile than for palm oil because if demand for PKO goes up, prices go up until somebody formulates out of it. If you want a tonne of C12-C14 fatty alcohol, you need 1.7 tonnes of PKO and 700kg of other material has to be sold. Your cost is 1.7 tonnes of PKO minus the by-product credits.”
Coconut Oil Prices move in tandem with Palm Kernel Oil.
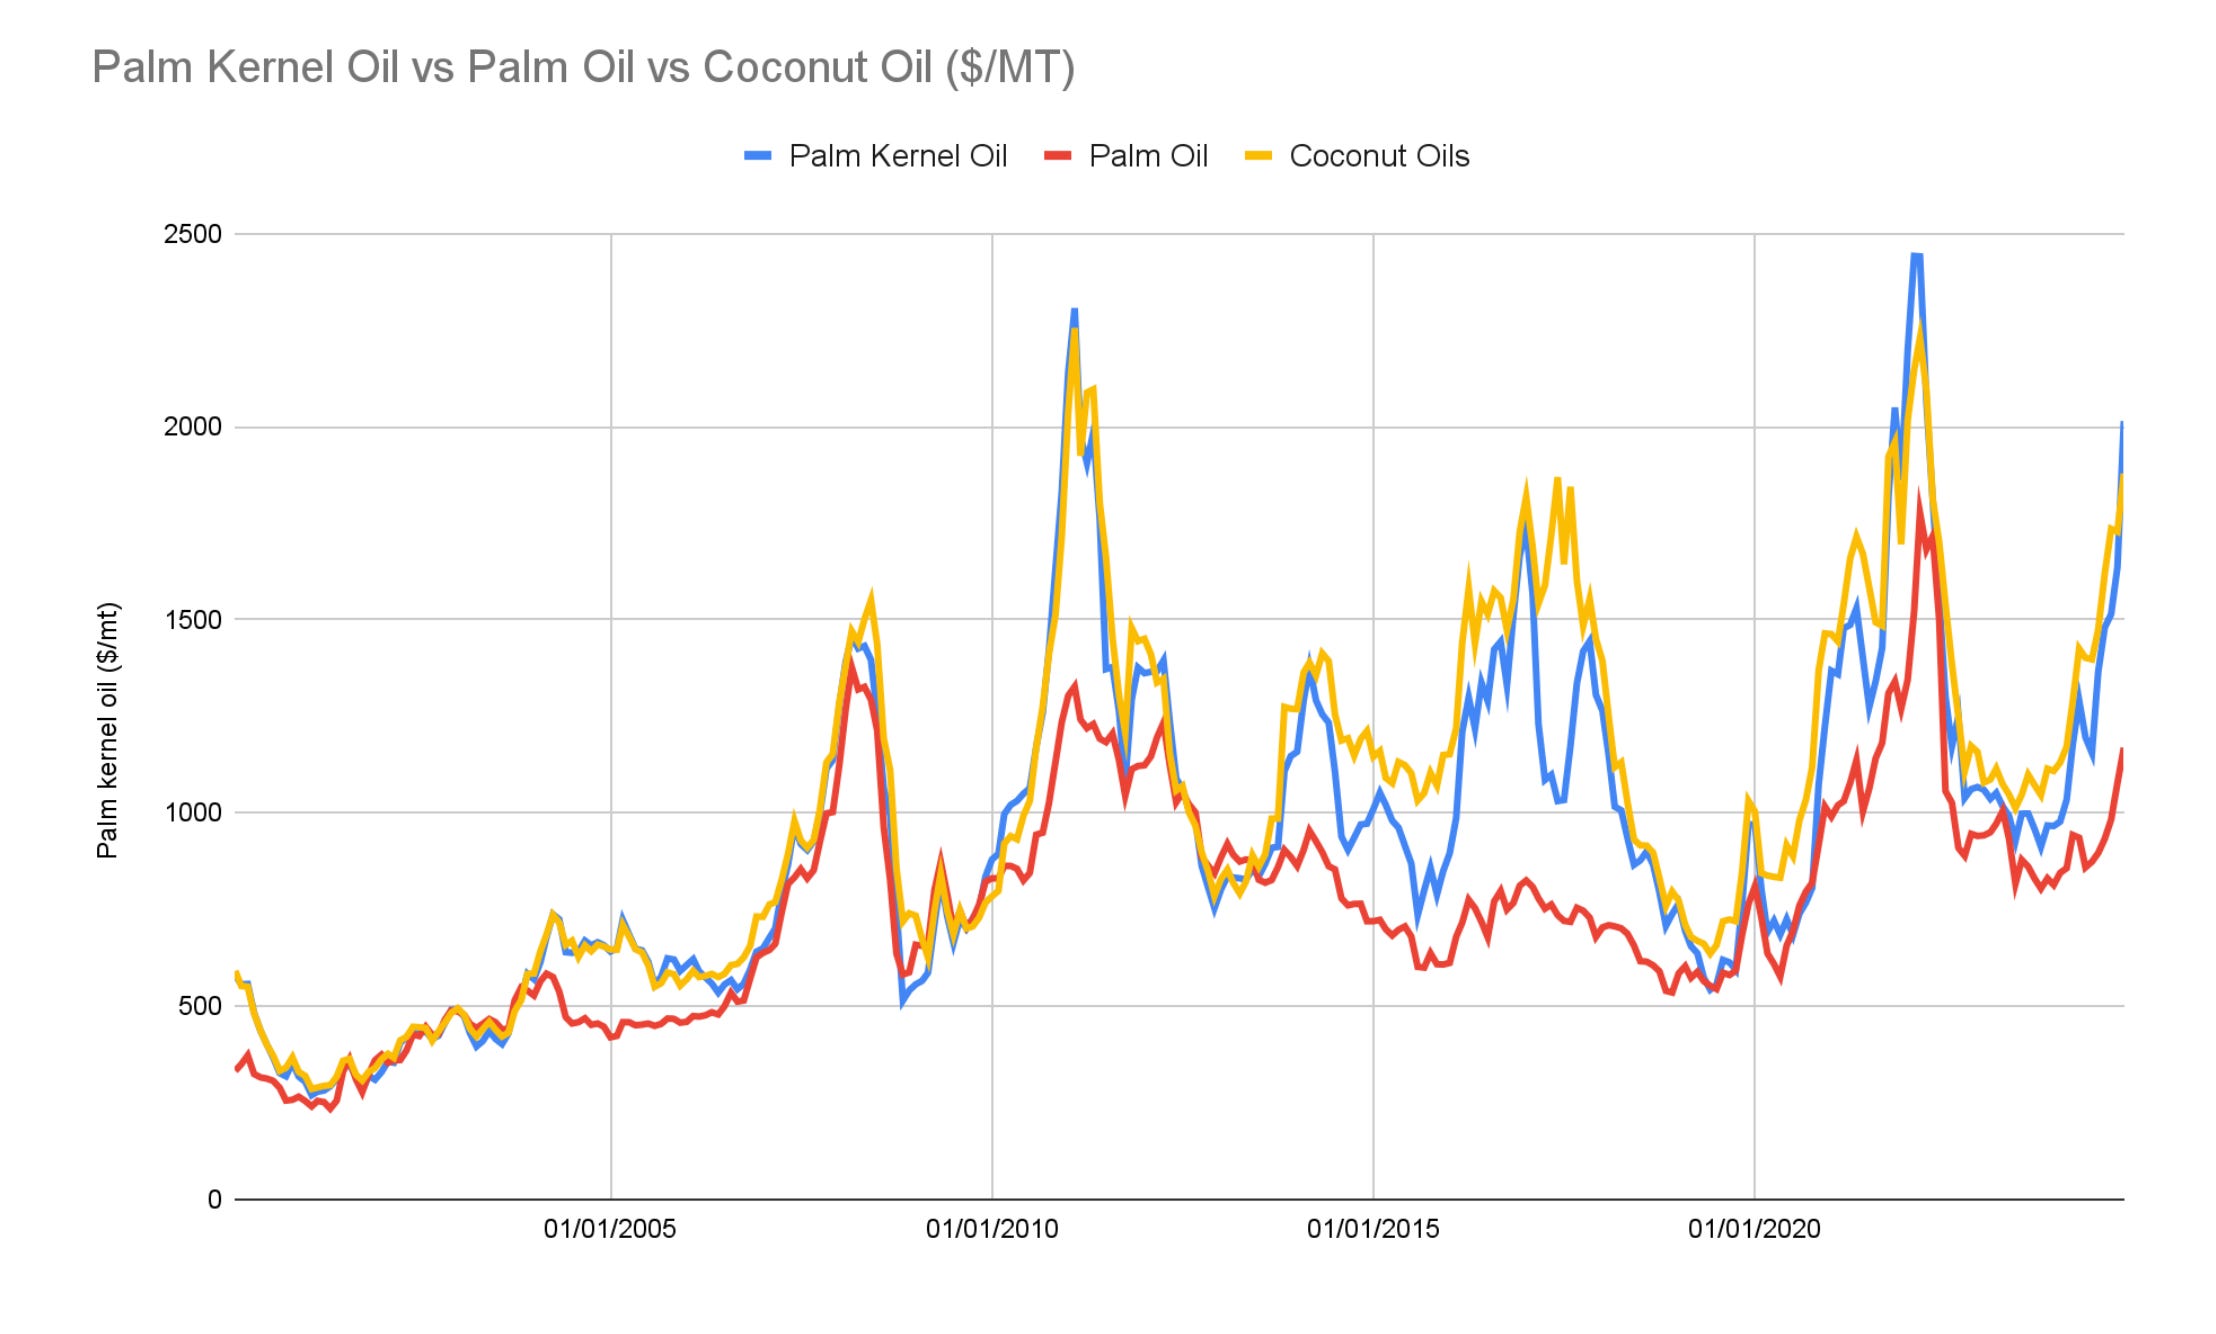
This shouldn’t be surprising given what we’ve learned earlier: the fatty acid profiles of both oils make them perfect substitutes. If the price of one rises, producers switch to the other to protect margins.
We have looked at ethylene pricing in the Packaging section and discussed the important role it plays in the surfactant production. It is fascinating to see that Ethylene has been cheaper than PKO for the past decade.
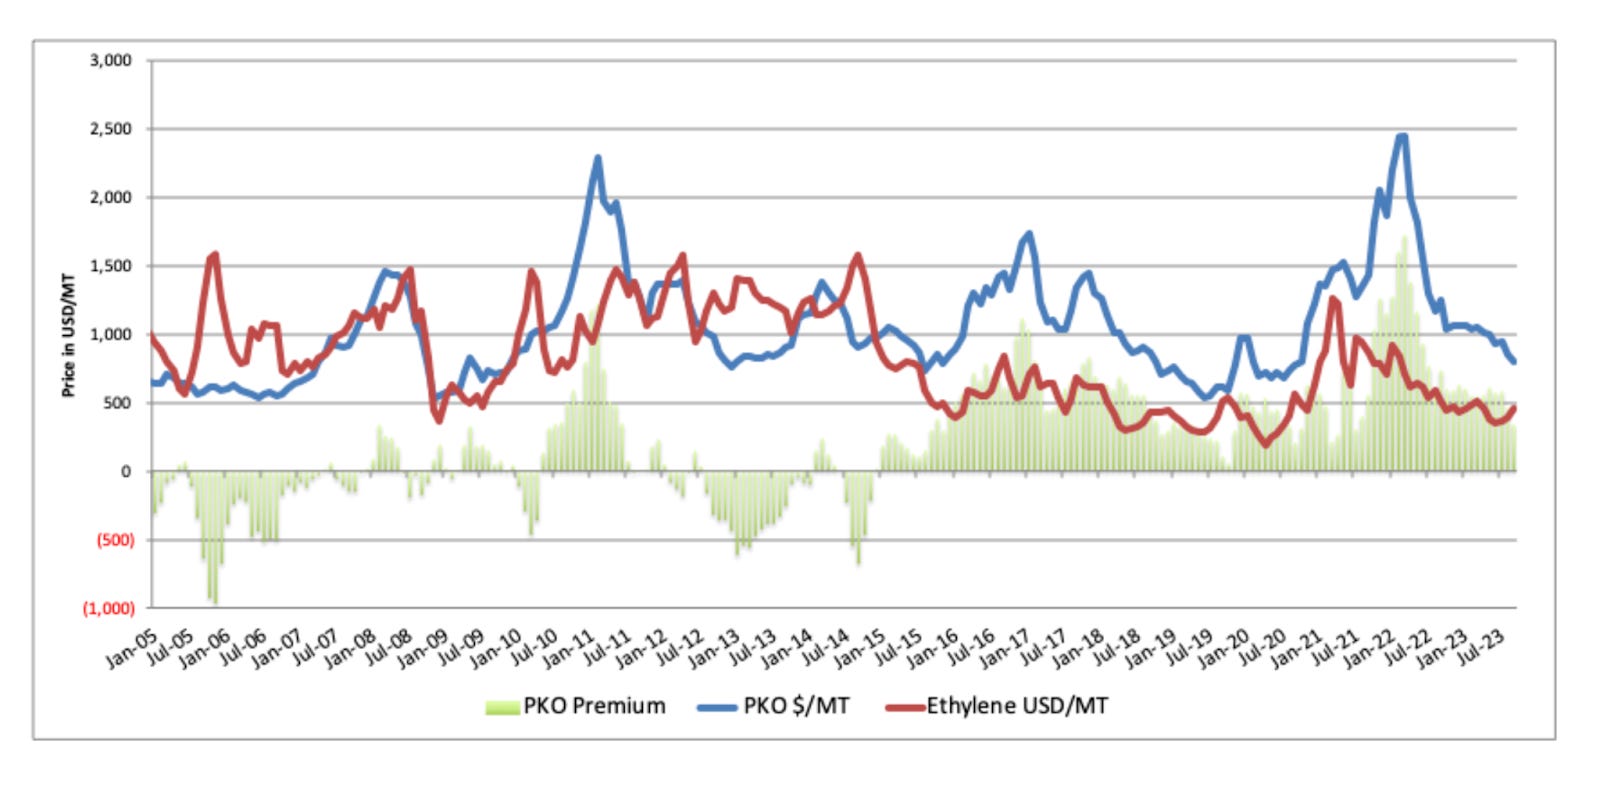
This indicates that Ethylene is not a perfect substitute for PKO.
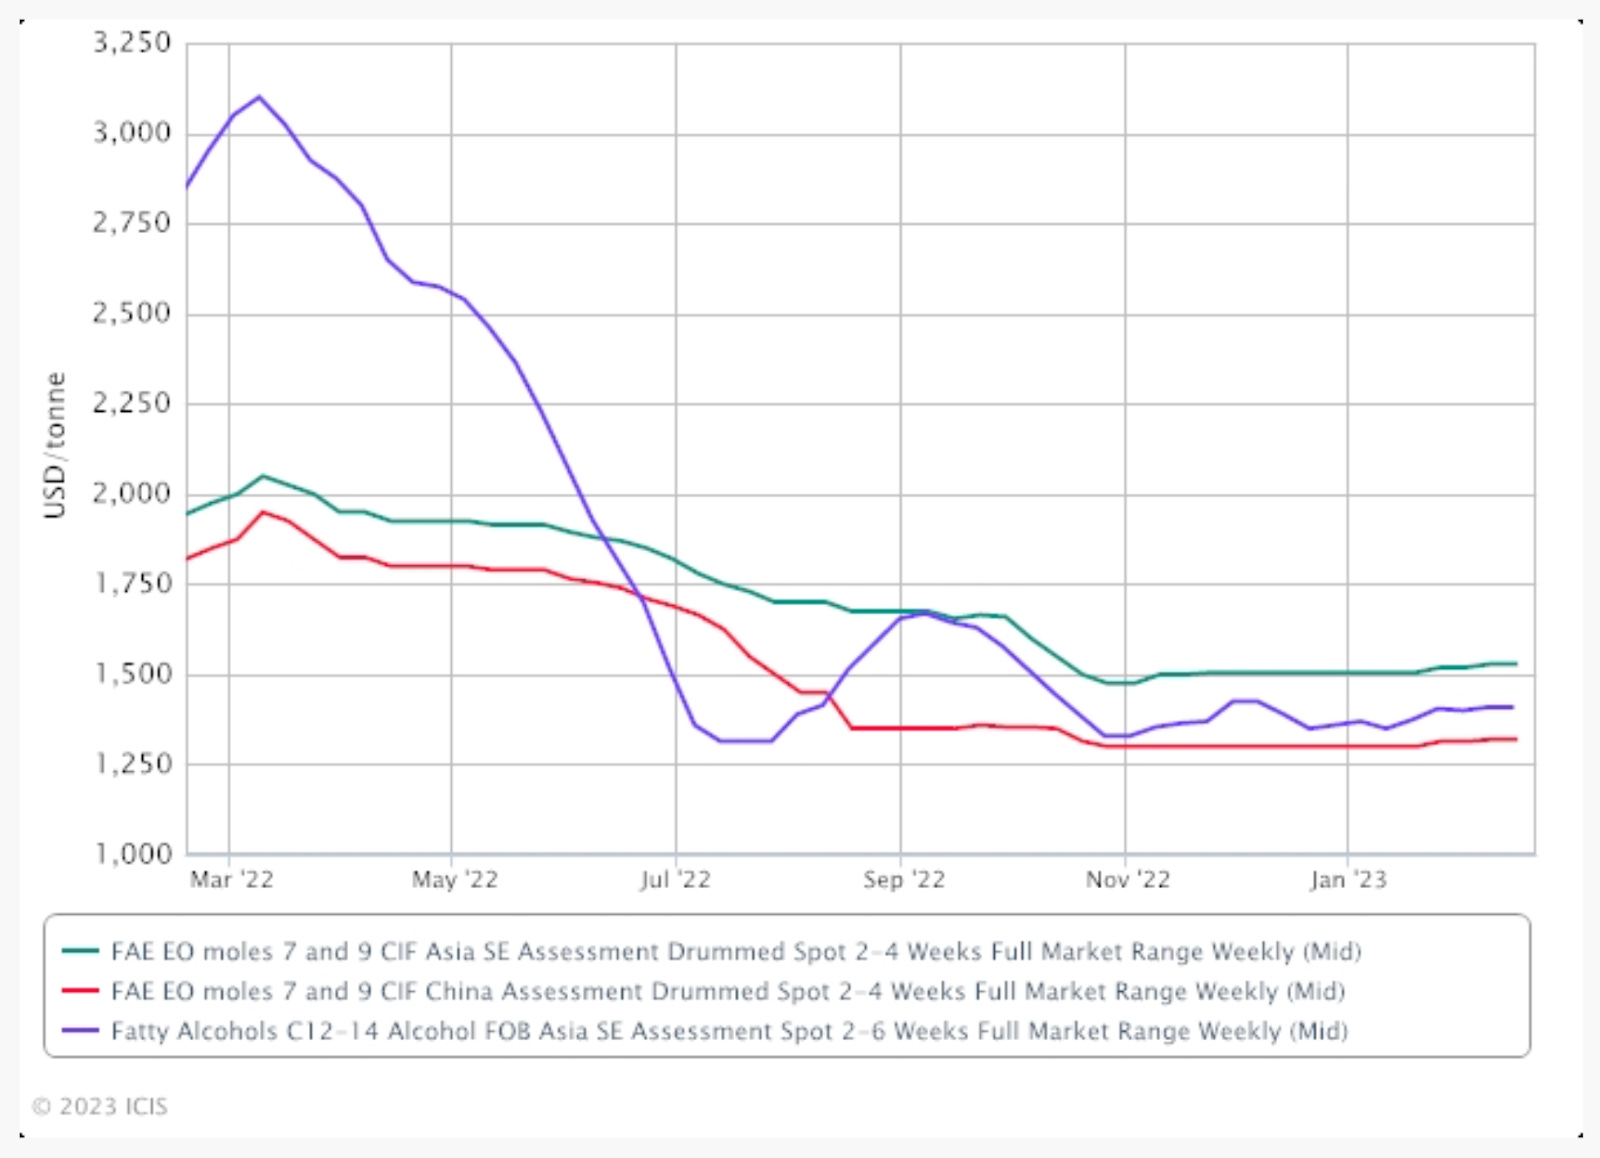
Fatty Alcohol Prices
Fatty Alcohols, specifically in SE Asia, correlate to PKO prices. In recent years, the spread seems to vary between 250 to 500 USD/MT.
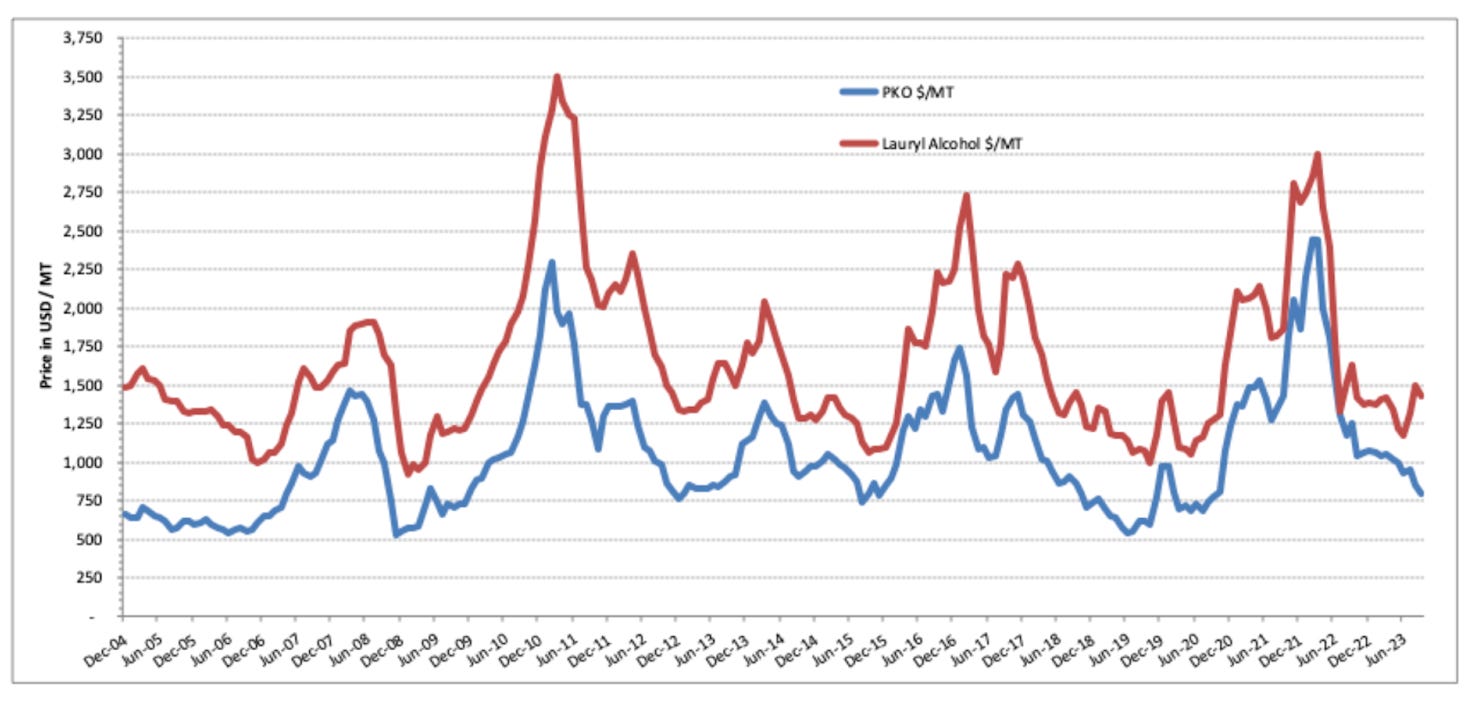
Fatty alcohols rarely stay above $2250 /MT for more than 6 months.
Ethylene Oxides, used to make Fatty Alcohol Ethoxylates which make up almost all non-ionic surfactants and few anionic surfactants like SLES, trades at a consistent substantial premium to Ethylene.
Season 1: Riding the Price Tsunami
During the pandemic inflation surge, or what I call season 1 of this soap opera, Palm Oil prices went through the roof.
One of the largest input costs is fertiliser, typically made from ammonia, which—like ethylene—is commonly derived from natural gas. All three spiked to unprecedented levels following Russia's invasion of Ukraine. Furthermore, as Russia and Ukraine are major suppliers of rapeseed and sunflower. This left downstream consumers of oleochemicals with little room to manoeuvre
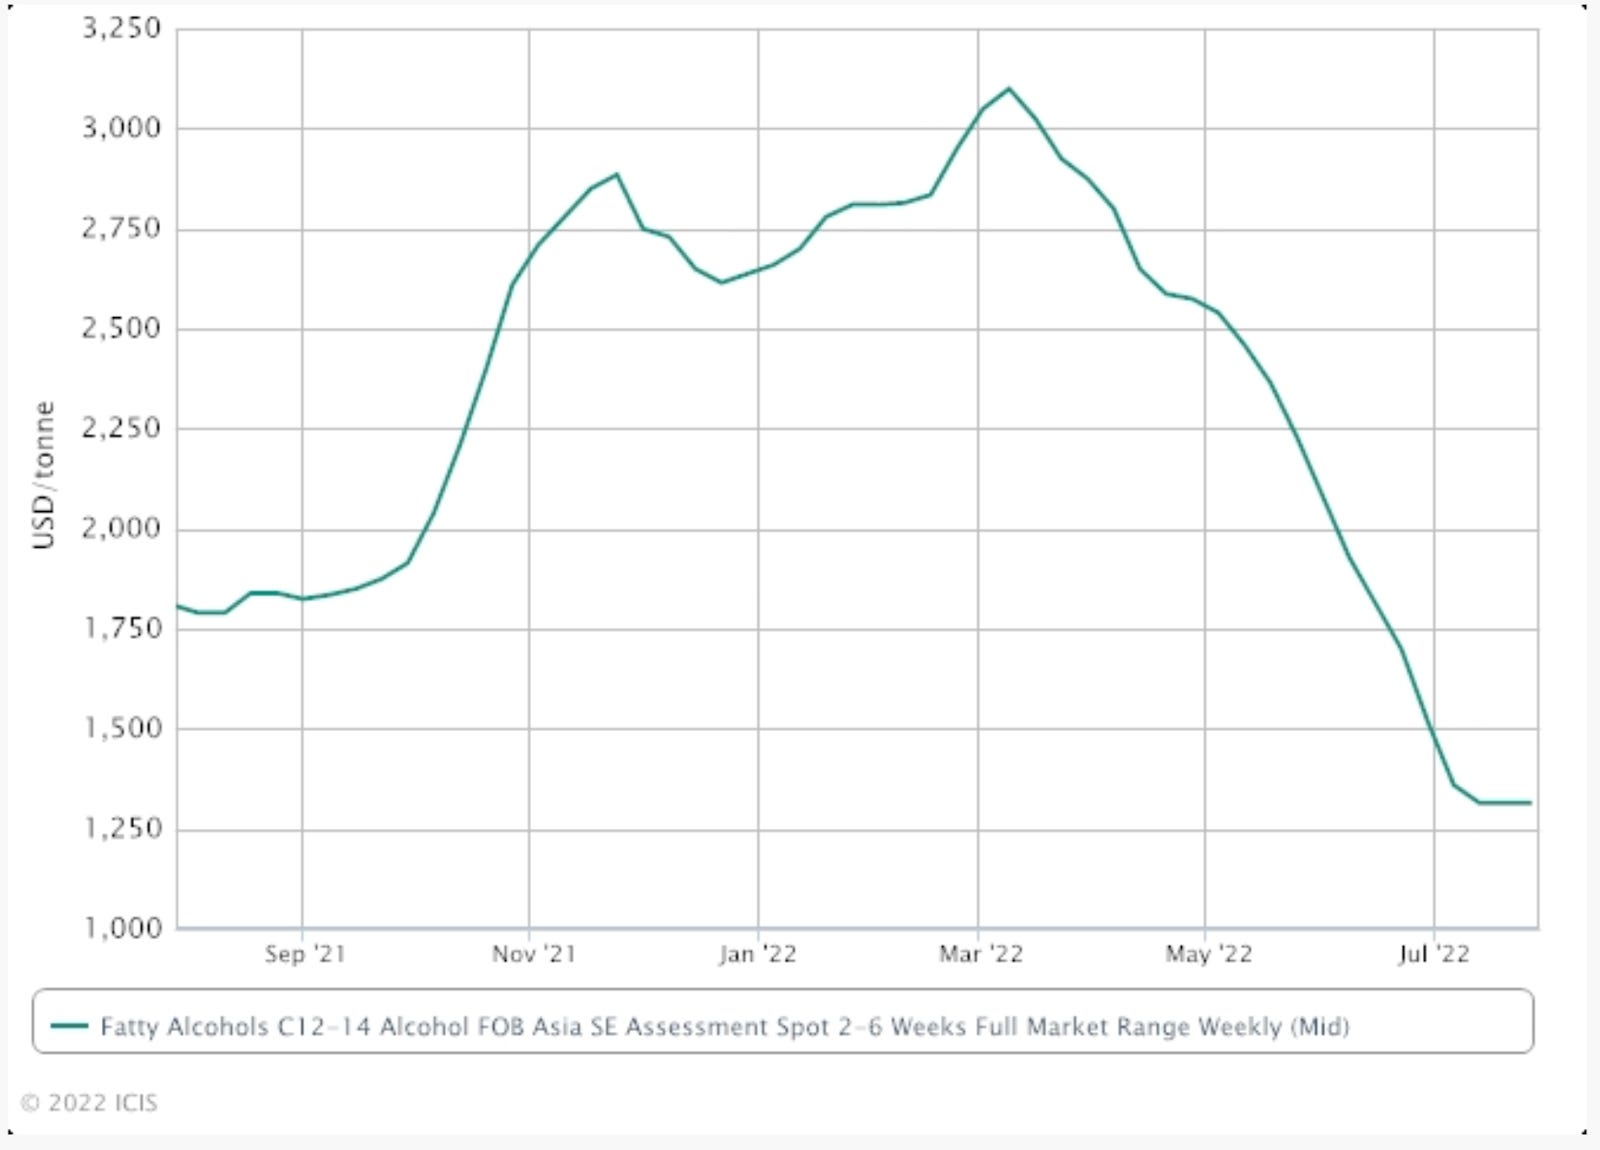
PKO prices spiking caused Fatty Alcohol prices to blow out too.
Fatty Alcohols:
Fatty Alcohols Ethoxylated:
Interestingly, Ethoxylated Alcohols (Fatty Alcohols + Ethylene Oxide) did not rise as sharply as Fatty Alcohols. This makes sense, as over 60% of their feedstock is Ethylene Oxide, which stayed below $1,400/MT.
Some quick math: $1,600 * 60% + $3,000 * 40% = $2,160/MT, aligning closely with the peak price for FEA. While the real picture is more nuanced, this confirms my basic assumptions. This will become more relevant when we estimate costs later.
Season 2: Another Palm Oil Squeeze?
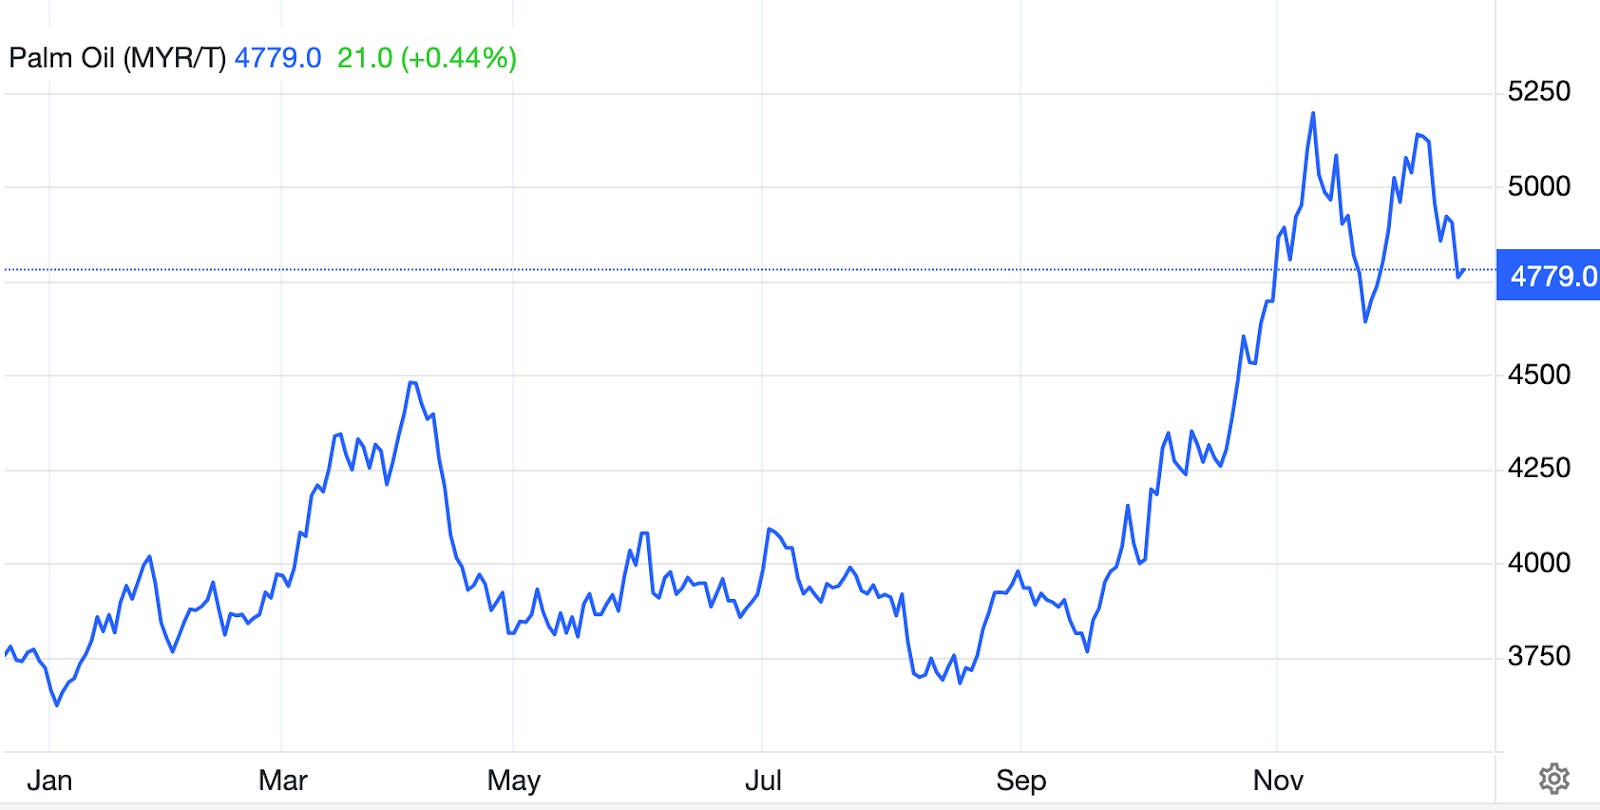
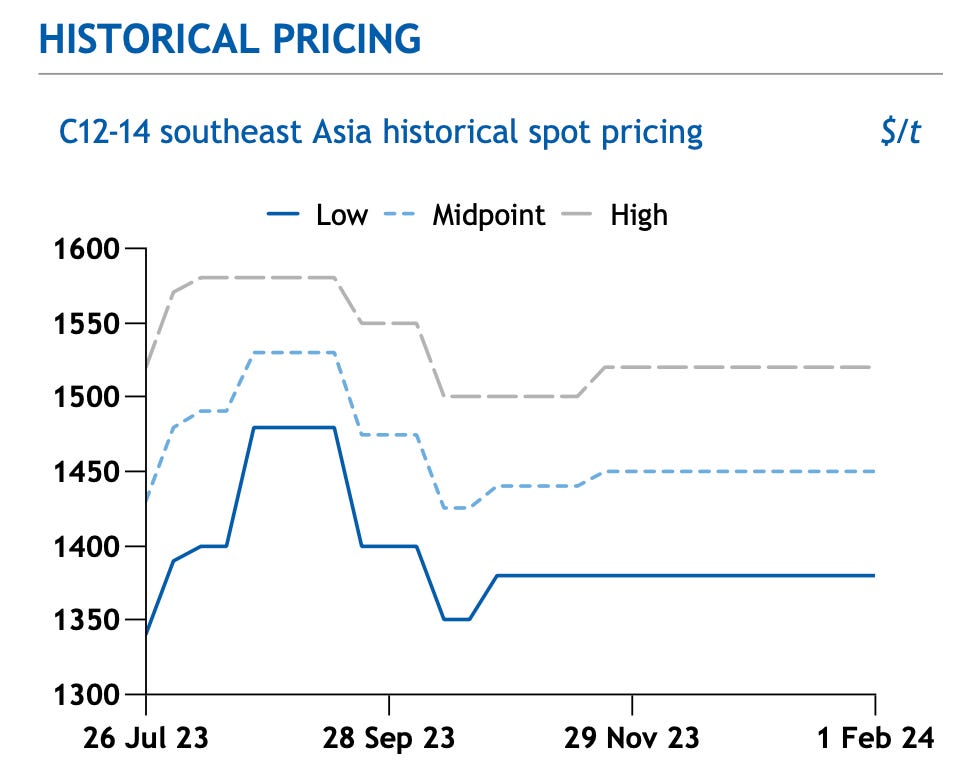
For most of last year, PKO and Coconut Oil prices hovered around $1,000/MT, while Southeast Asian Fatty Alcohol prices averaged $1,450/MT during the same period.
Since then the picture changed dramatically.
‘Fatty Alcohol mid cut C12-14 have been on a relentless uptrend since mid-June. On 18th September the price averaged 2080 dollars FOB SE Asia., up nearly 40% since mid June when prices were 1500 FOB SE Asia.’ — Helen Yan ICIS Podcast Episode 1246
Why are Palm Oil Prices Surging Now?
There are a number of stories and factors being discussed on both supply side and demand side.
Supply
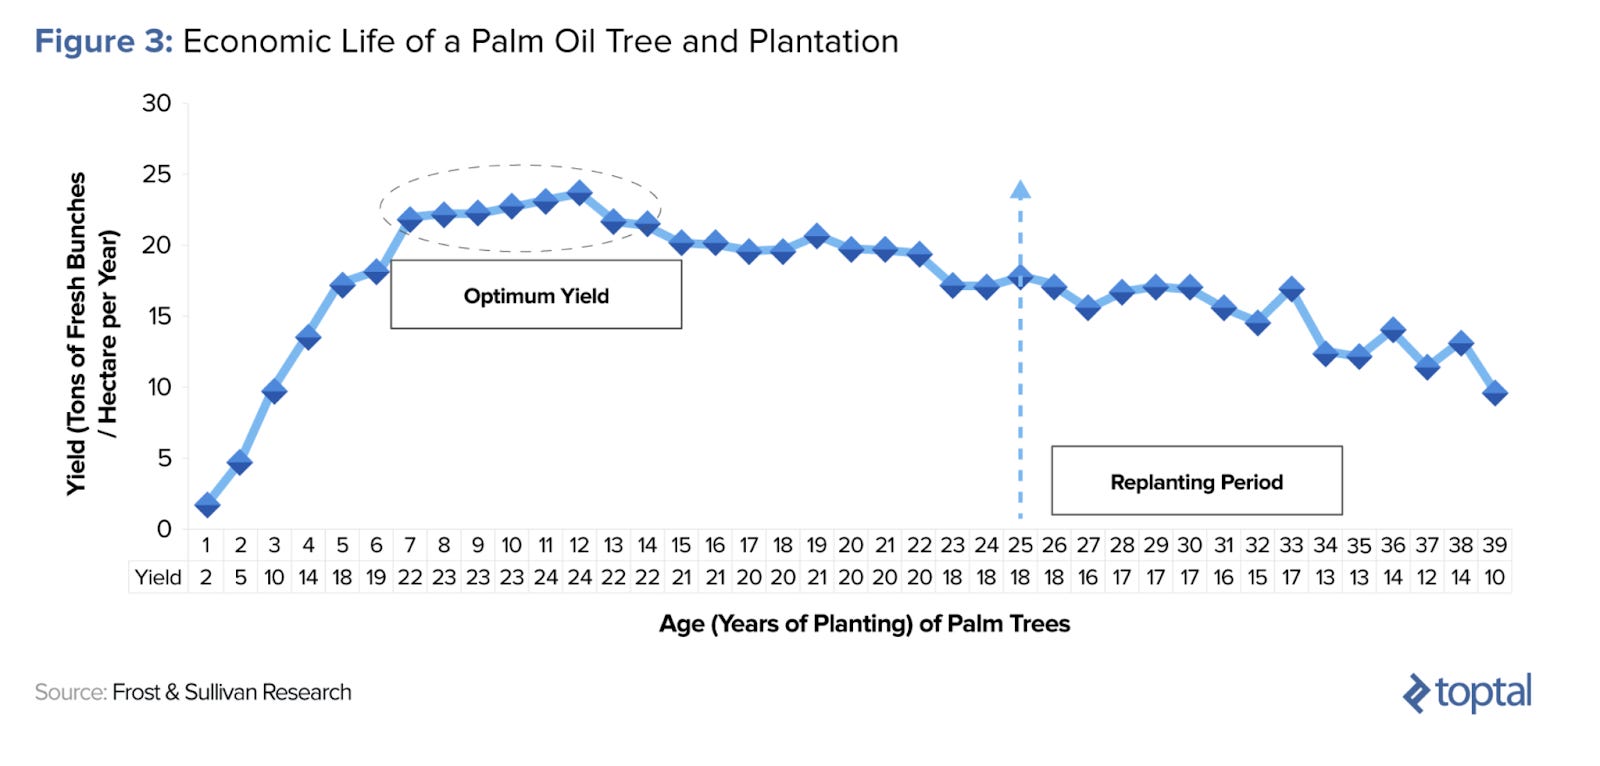
An aging tree population, caused by insufficient replanting, is leading to declining yields. In Malaysia, 30% of palm trees are at least 19 years old, an age where yields begin to drop, and 12% are over 25 years old.
Replanting has been slow, primarily due to high labor costs. Elevated palm oil prices further incentivise producers to maximize short-term profits by continuing to harvest older, lower-yielding trees and prioritising limited labor resources for harvesting rather than replanting.
Replanting is inherently a long-term investment, as new trees take over three years to become commercially viable, with peak yields occurring between 9 and 18 years of age. Smaller plantations, even with government support, often struggle to afford the upfront costs of replanting, exacerbating the issue.
While Indonesia initially targeted replanting 180,000 hectares annually, only 360,000 hectares have been replanted since 2017 due to limited funding. Without significant rejuvenation efforts, Indonesia's crude palm oil output could fall from around 50 million metric tons today to 44 million by 2045. Output is already expected to decline by 1 million tons in 2024.
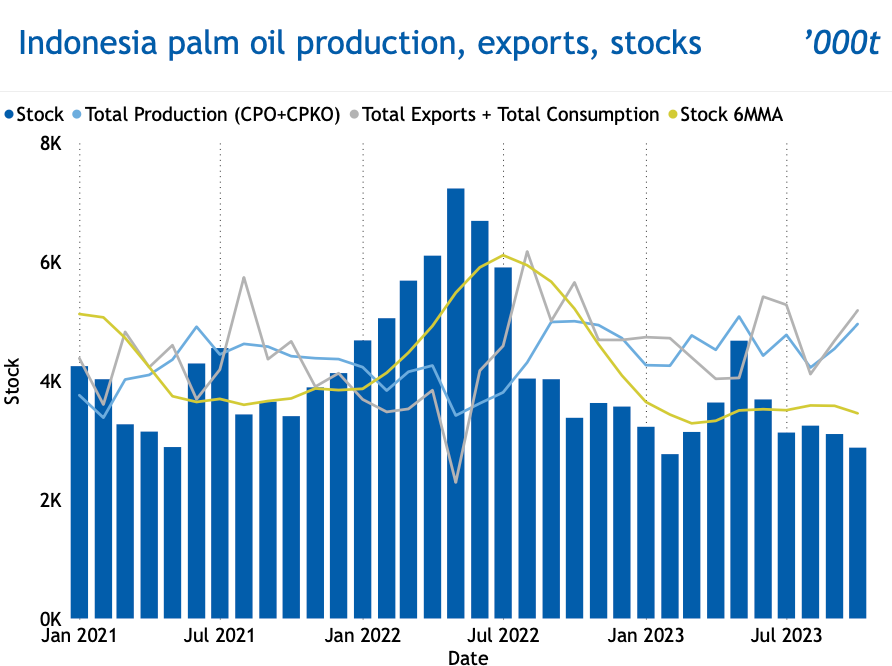
Compounding the issue, recent severe flooding in Malaysia, the worst in decades, and low inventories in both Malaysia and Indonesia have further strained supply. Additionally, the impact of El Niño has disrupted both palm oil production and replanting efforts.
Demand
Indonesia plans to increase its mandatory biodiesel blend to 40% palm oil (B40) by 2025, which will require an additional 2.9 million tons of palm oil annually. Similarly, Malaysia is expanding its B20 biodiesel mandate, further boosting demand. ⬆️
Additionally, there is growing global demand for "sustainable" and "natural" products, which often rely on palm oil as a key ingredient. ⬆️
In the short term, buyers have been stockpiling palm oil in anticipation of the EU Deforestation Regulation (EUDR), initially set to take effect in December 2024. However, the 12-month postponement of the regulation may now result in a period of destocking. ⬇️
Finally, recent global economic weakness has led to reduced demand across many end markets, which is likely to limit upward pressure on palm oil prices. ⬇️
Palm Oil Substitutes
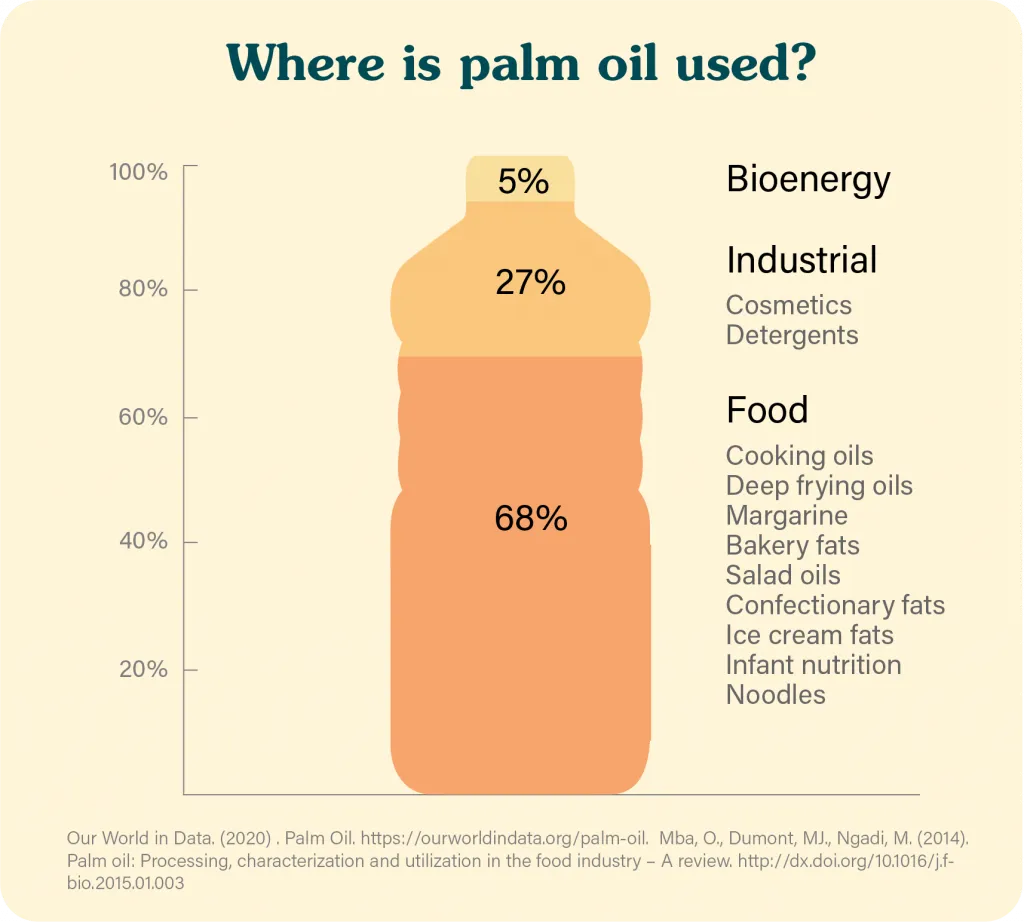
As with any commodity, when prices rise too high, buyers seek substitutes and reduce consumption. Unlike in 2022, ethylene prices have not surged, allowing detergent producers to switch to surfactants derived from petrochemicals. However, the majority of palm oil is used in food production, with soybean oil being its main competitor. Therefore, it’s important to briefly examine other vegetable oils.
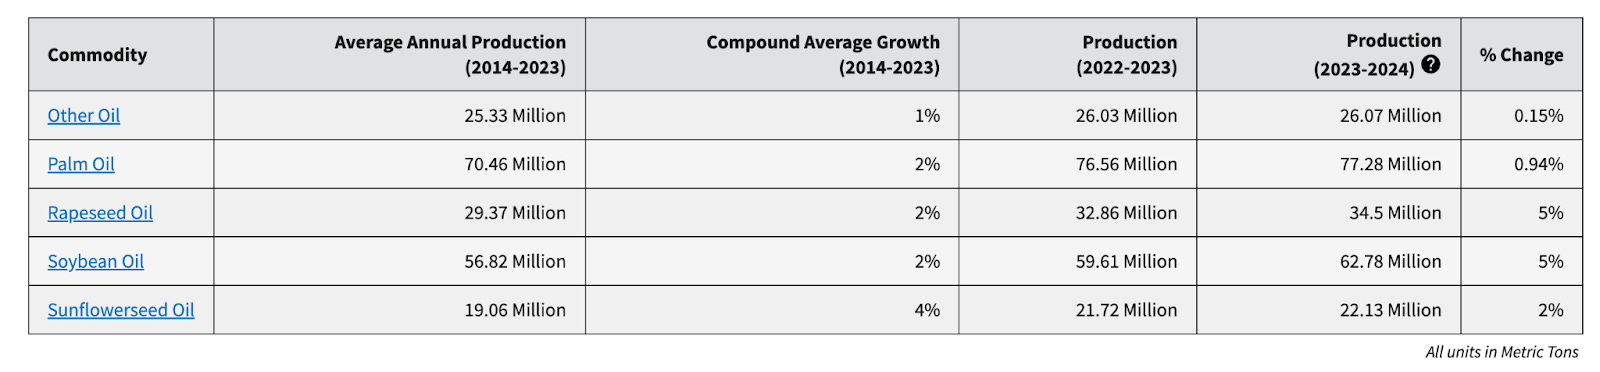
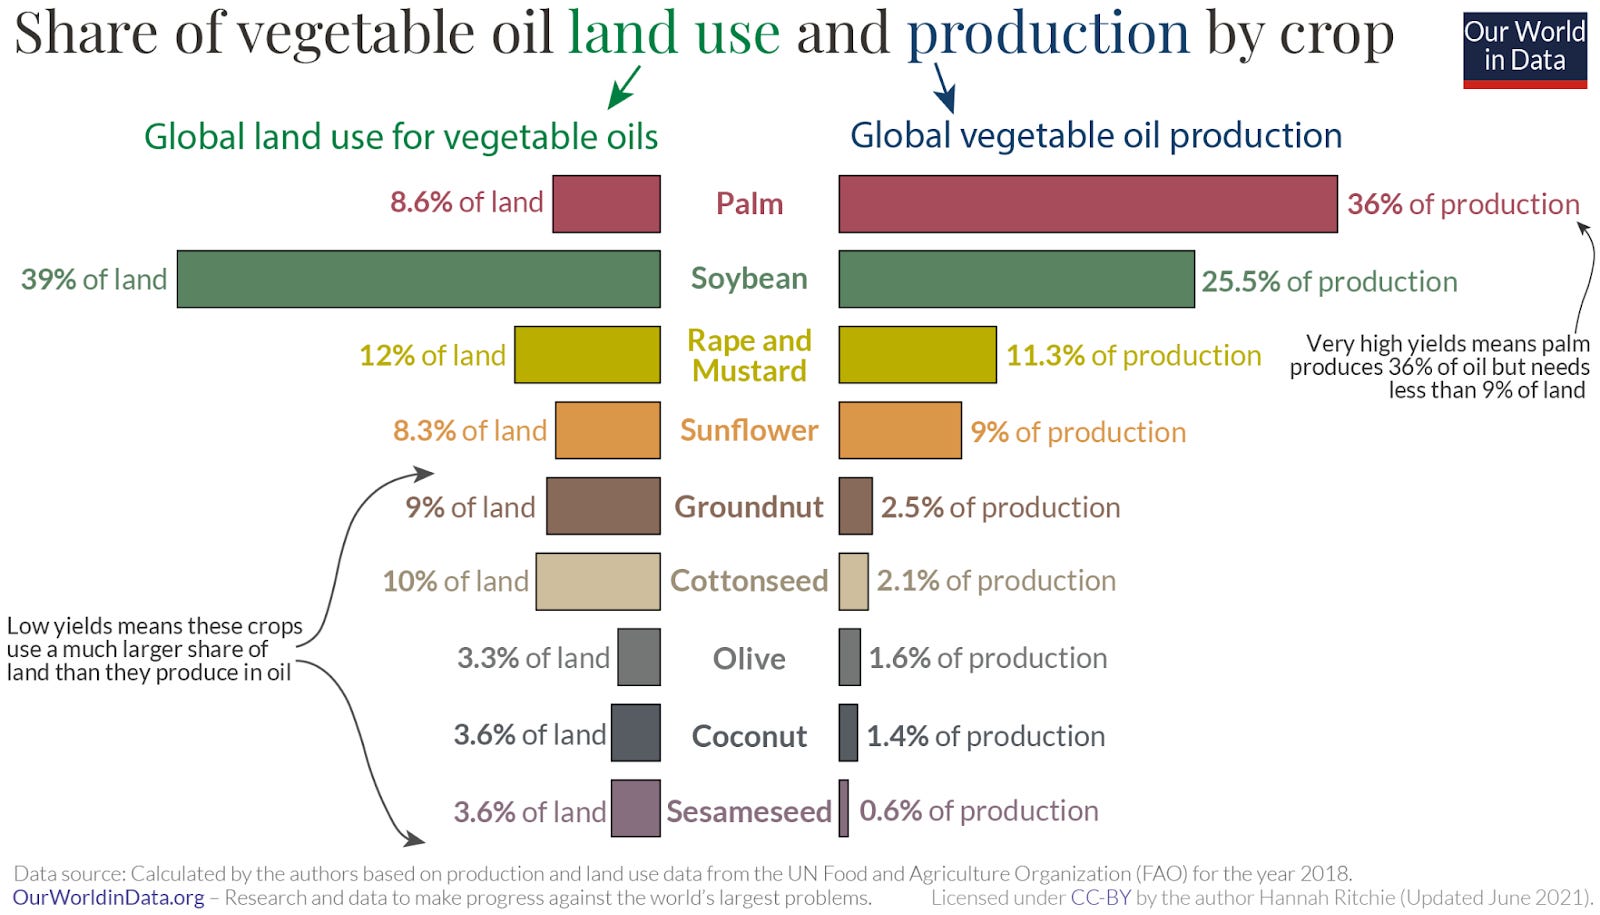
Historically palm oil has been the cheapest oil since the production capacity is so large. It has a very significant advantage over other oils — it is the most efficient in terms of yield per area of land.
Despite being the top most produced oil with close to 40% share of vegetable oils. Palm oil uses less than 9% of land.
Soybean oil typically trades at a premium to palm oil, a trend that persisted even during the 2022 price surge. However, recently, abundant soybean harvests have put downward pressure on prices. The few instances where this relationship reversed were short-lived.
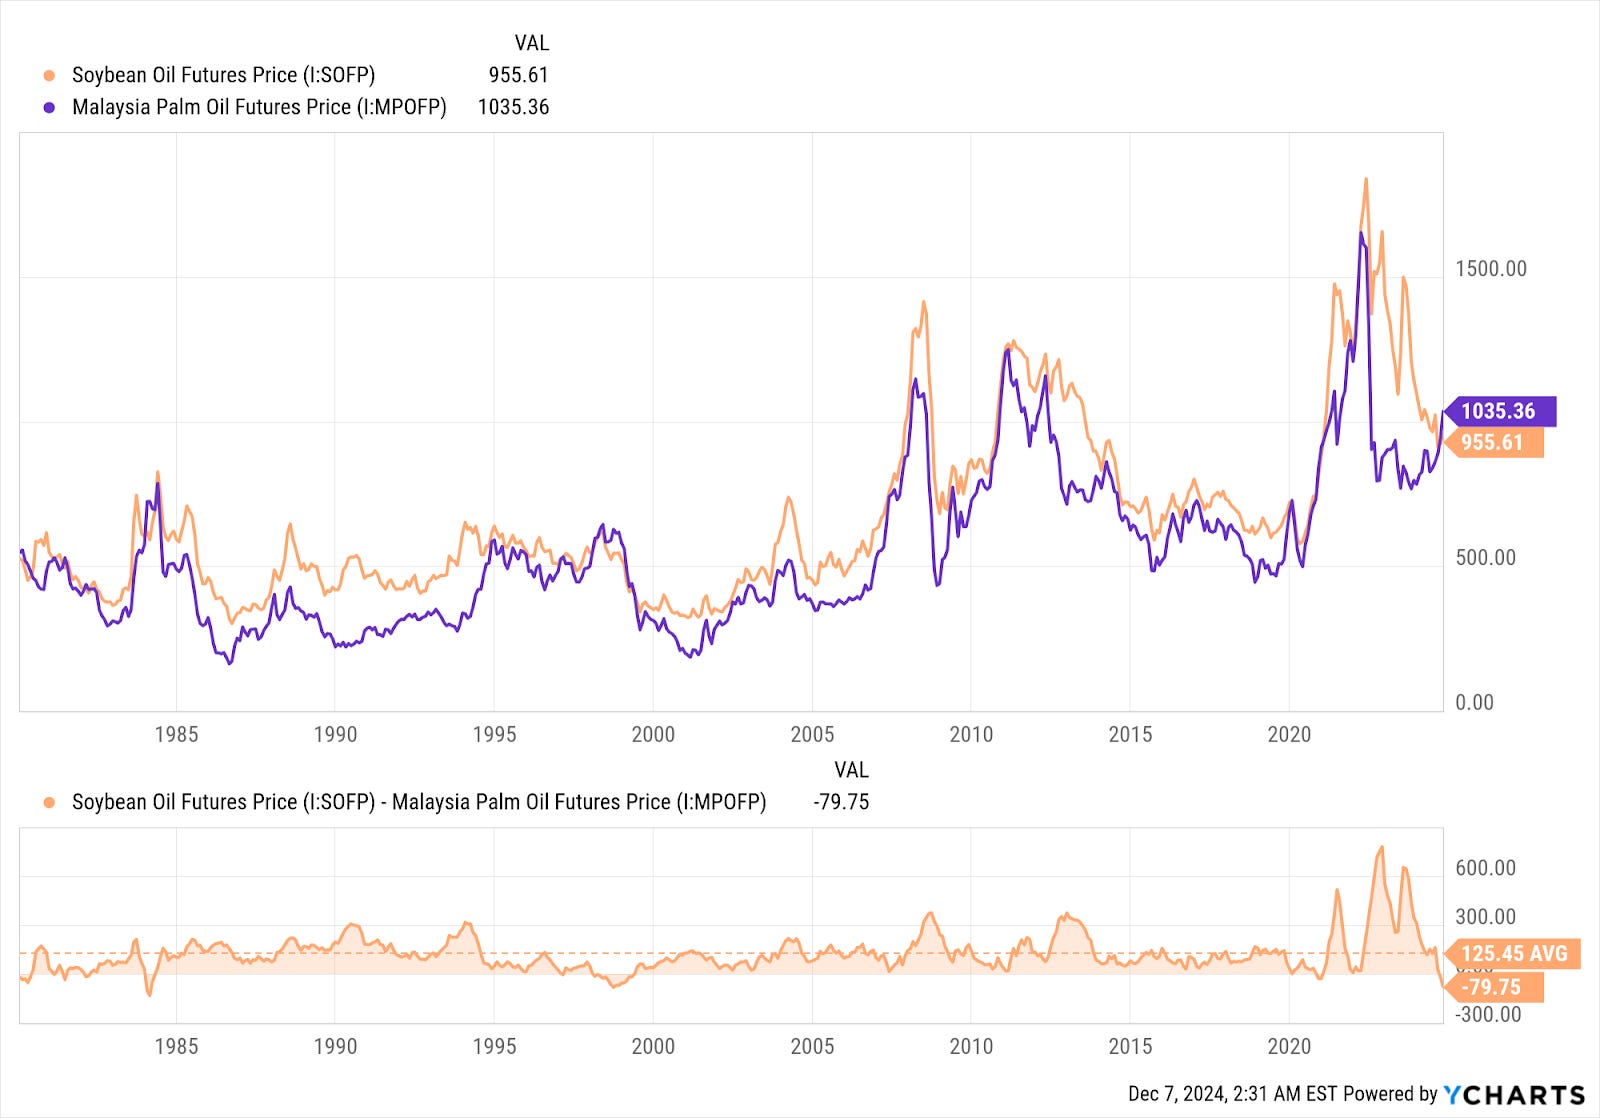
History suggests that palm oil prices will need to fall, or soybean oil prices will need to rise as food producers seek substitutes for the more expensive palm oil. This is particularly relevant in price-sensitive markets like India, a major importer of palm oil.
Rapeseed oil is another alternative, typically trading at a significant premium in normal times. However, this premium has narrowed over the past few months.
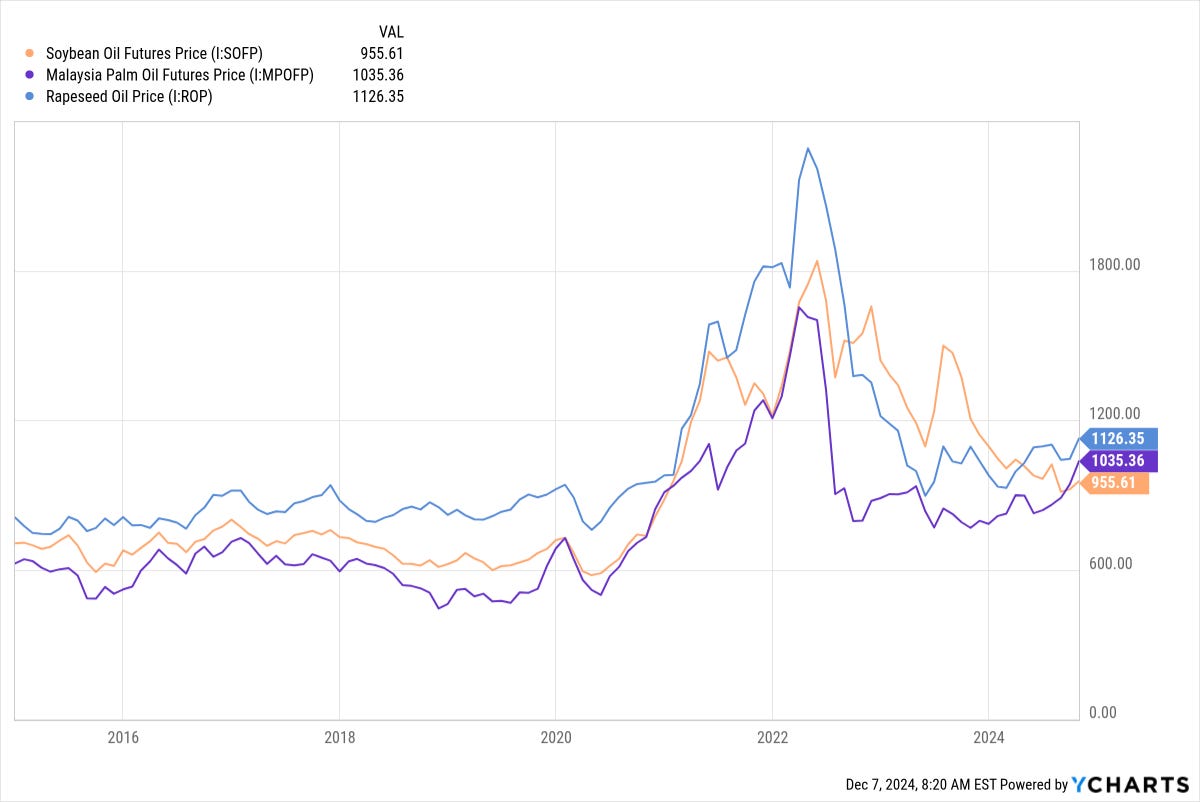
I think these are interesting trends that point to Palm Oil being overvalued relative to other vegetable oils according to its recent history.
These trends are worth keeping an eye on.
Cost Estimates
All volume and weight figures presented are based on annual data, so any impact assessment reflects an annualized view. Therefore, when thinking of prices we need to think about what the average price will be across the year as opposed to the current spot price.

The previous record highest 12 month average for PKO prices was $1973/MT in 2022 and in the previous 2012 cycle at $1806 /MT. Fatty Acid peak averages were likely around $400-500 more per metric tonne.
Price Assumptions:
FOB SE Asia prices for Fatty Alcohols (FA) were ~$1500/MT for most of the year.
Current PKO prices are $1900/MT, implying FA prices are likely ~$2300/MT. As observed before, this is an extreme level of prices that usually does not hold for long.
Assuming the premium between Europe and Asia stayed the same, the cost differential is $800/MT. I treat this as my base case average price.
Due to PKO price volatility and structural issues in palm oil production, I assume a worst-case scenario average price level of $1000/MT.
This would push FA prices to $2500/MT. Even during the 2022 cycle prices held above $2500/MT for only 7 months.
Fatty Alcohol Ethoxylated (FAE) prices, largely estimated using the formula described above, moved from $1500/MT to $1750/MT for a cost differential of $500/MT
Surfactant manufacturers pass on the prices of fatty alcohols and other feedstock directly with a constant markup.
Assumption 7 warrants a note. In my modelling, I am focusing on estimating the increase in costs rather than the absolute costs. Since the costs of Sulfur Trioxide and Ammonia have remained flat, I simply exclude the volume they account for, which simplifies the modelling process given the many moving parts. Tracking manufacturer markups or markdowns would also be exceptionally difficult. As a sanity check, I will present my estimates later.
So you don’t have to scroll up here are the surfactant detergent ranges:

It is worth keeping in mind that companies are only required to disclose weight ranges rather than exact amounts of ingredients. Therefore, 5-15% non-ionic could be anything in between, quite an obstacle for exact modelling.
It's important to note that surface cleaners contain significantly fewer surfactants, with some containing none at all. This is a key consideration, as higher surface cleaner volumes would reduce the amount of surfactants needed.
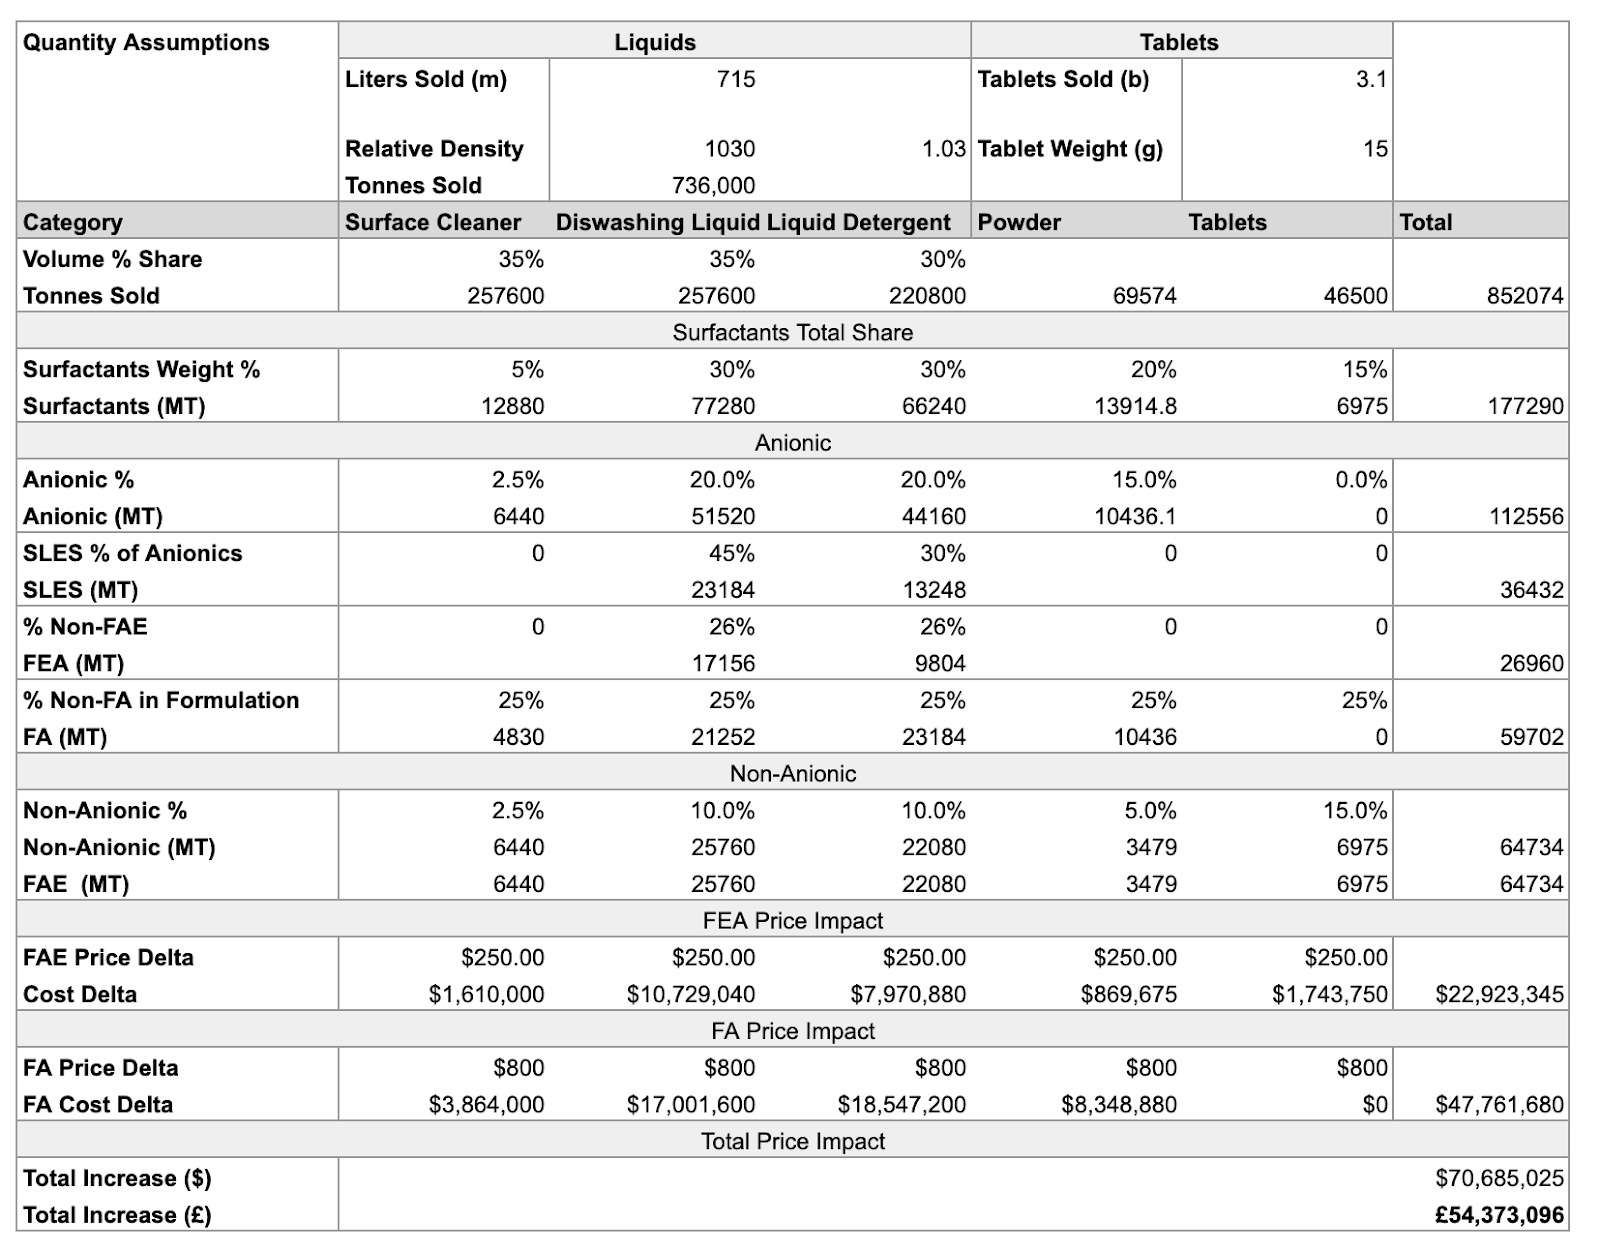
As shown in the table, the total impact based on the above assumptions results in a devastating 54.4 million increase in costs. For formulation, I used mid-range estimates, with active compounds making up around 30% of the weight in detergent liquids and 15% in powders. Some detergents can go up to 45%, so this is not overly conservative. I’ve highlighted SLES, as it seems to make up a significant portion of Anionics and uses ethoxylated alcohols. To ensure I'm not being overly punitive, I performed a sensitivity analysis for different price changes and average formulation strengths.
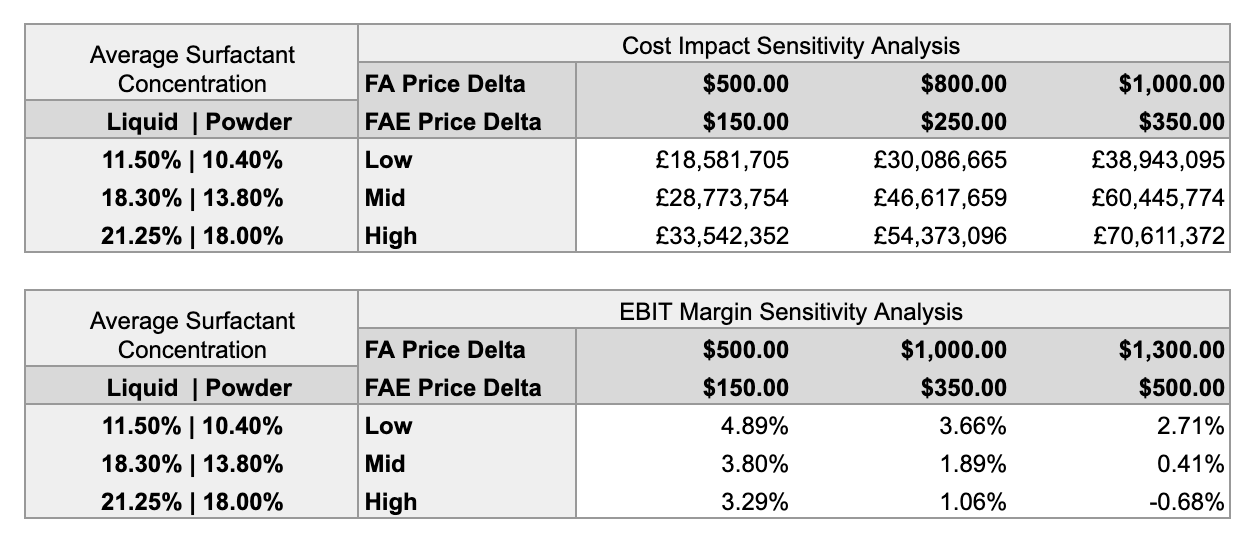
Even in the best case scenario, 30% of the operating margin evaporates. In the rest of the cases, McBride loses almost all profits. In the ‘low’ case, if we exclude surface cleaners, liquid surfactant concentration is 15%. I don't feel comfortable assuming even weaker concentrations.
Assuming 3% volume growth and a 1% price increase, FY25 revenue reaches £972m. Factoring in £54m of additional costs and a 3% rise in base costs, gross profit would total £314m, resulting in a gross margin of 32.25%—similar to the 32.5%-31.4% range seen in 2011-2012. With a 4% increase in SGA, EBIT comes in at approximately £20m.
Of course, this business does not exist in a vacuum. It is likely that McBride’s chemists are already developing new formulations using cheaper feedstocks, such as petrochemical-based surfactants like LAS or surfactants made with synthetic fatty alcohols. However, other companies are likely pursuing similar substitutes, which could drive prices higher for these alternatives as well. As you can see from the sensitivity table even a small price increase in Fatty Alcohols would hit the company hard.
Let’s not forget the company’s debt, which was recently refinanced without disclosing the terms. While £110 million of debt doesn’t look overly concerning with £64 million of EBIT, it becomes far more problematic at £20 million of EBIT. At this lower level of profitability, the company would be trading at over 15x EV/EBIT. To get to a more reasonable 10 EV/EBIT would require a -50% correction. Leverage is dangerous!
Sanity Check
As a final sanity check, I want to approximate absolute feedstock costs based on the volumes in my model and see how they match up to the companies stated input costs of £520 million in FY24.
I assumed original prices for FA/FAE in Europe averaged between $1700-2000/MT, a $200-500/MT markup over SE Asia prices. This would put base FA/FAE feedstock costs in my 'high' formulation between £200-230 million.
Sulfur costs are less than $100/MT, and ammonia costs are slightly more expensive at $450/MT. Assuming the rest of the surfactant manufacturing feedstock costs are a mix of both adds only £5-8 million. Stepan, a global surfactant producer, had gross margins in its surfactant segment of ~15% in 2022, with materials accounting for ~60% of sales. This means roughly 25% is other manufacturing costs. I will use 35% as the markup on top of the discussed feedstock costs.
The final estimate of surfactant costs to McBride, under these assumptions, is ~£280-330 million.
I previously estimated:
Plastics to be between £50-100 million
Paper costs at ~£8 million.
Soda Ash ~ £22 million.
So, the total costs identified are £360-460 million. Total material costs were £520 million in FY24, meaning there is at least another £60-160 million remaining to cover various remaining solvents, acids, enzymes and perfumes.
Given this, I do not believe my estimates of surfactant volumes under the ‘high’ scenario are excessive.
Pricing
In 2022, the company was unable to pass on price increases due to the nature of its contracts with retailers. Since then, management has stated that they have shifted to shorter-term pricing agreements, which could help the company better manage inflation. However, even a relatively large 5% price increase, would still not be enough to offset all the rising costs if my model is reasonably accurate.
Interestingly, this is not the first time they have ran into pricing issues with retailers. Here is a quote from 2012:
‘Many retailer contracts preclude price changes without six months’ prior notice’
I wonder if the can maintain the new ‘shorter-term’ pricing arrangements in the long run.
Does McBride have Pricing Power?
Despite its market share, I do not believe this is the case. Looking at the company’s history, it performed well during the financial crisis, with rising demand helping lift its bottom line. However, from 2011 until the pandemic, each financial statement has referenced weak demand, pressure from retailers, or promotional activities by brands.
‘Retailers have become increasingly competitive and branded promotional activity has remained at record levels, especially in the UK’ - FY11
‘The unprecedented level of branded promotional activity in our third quarter further impacted revenues and, ultimately, our operating profit and earnings’ - FY13
‘Continuing to see private label volumes under pressure from branders and high levels of in-store promotional activity.’ - FY17
‘Decreased volume levels … driven largely by high promotional activities from brands. We have also seen negative customer reaction following our pricing actions’ - FY19
This is not surprising for a business that sells commoditised products. This is definitely not Buffet’s See’s Candies.
Final Remarks
Ultimately, everything will depend on how long palm oil prices stay elevated. My modelling demonstrates the risk associated with the current palm kernel oil surge. This risk is accentuated by leverage. That said, you should not rely on my views—always do your own research. I hope this article has provided you with the key concepts to better navigate this space, along with some useful charts to monitor.
Bonus Idea: Harvesting the Surge
MP Evans Group PLC trades on the LSE under ticker symbol $MPE manages a number of plantations in Indonesia. Key facts:
Annual crop growth 11% in a decade to 2023.
Manage 65,000 hectares in Indonesia.
Average age of the Group’s palms was ten years. Best years still ahead for the average tree!
Trading at ~9 EV/EBIT on normalised/bottom prices of 2023 assuming
Current dividend plus + buyback yield of ~5%.
Own processing mills.
While I haven't conducted a lot of research, the idea is appealing due to the operating leverage inherent in a high fixed-cost business. With unit costs per tonne ranging between $420 and $520, a structural increase in palm oil prices by $100-200/MT in the mid-term could result in a significantly more profitable business, accompanied by growth and attractive shareholder distributions. The stock did go up by 10%, so some of the palm oil price movement is priced in — this works as a hedge only if prices stay higher for longer.
Disclaimer: Nothing discussed here constitutes investment advice and is for informational purposes only. I am not a qualified financial advisor. I may trade securities discussed at any time without prior notification. Always do your own due diligence and seek a qualified financial advisor before making investment decisions.
Sources
Paper Prices
The Price of Pulp at the End of 2024
Source: Pricepedia
Palm Oil Prices
Indonesia's Chief Economic Minister Confident in Boosting Palm Oil Production
Source: ReutersShrinking Global Palm Oil Supplies and Strong Biodiesel Demand Boost Prices
Source: ReutersPalm Oil Production Crisis Due to Lagging Replanting
Source: PwCSoyoil Power and Palm Oil's Record Premium
Source: ReutersPalm Oil Investing Overview
Source: Toptal
Coconut Oil
The Role of Coconut Oil in the Oleochemical Industry Worldwide
Source: Wiley Catalog
Surfactant & Fatty Alcohols
Surfactants Monthly – September 2023
Source: Neil A. BurnsSpotify Podcast Episode
Source: Open SpotifyFatty Acids and Their Oleochemical Applications
Source: OCL Journal (2001)
Really impressive. Thanks for taking the time to research and share all that.
Excellent article.